Fig. 9.
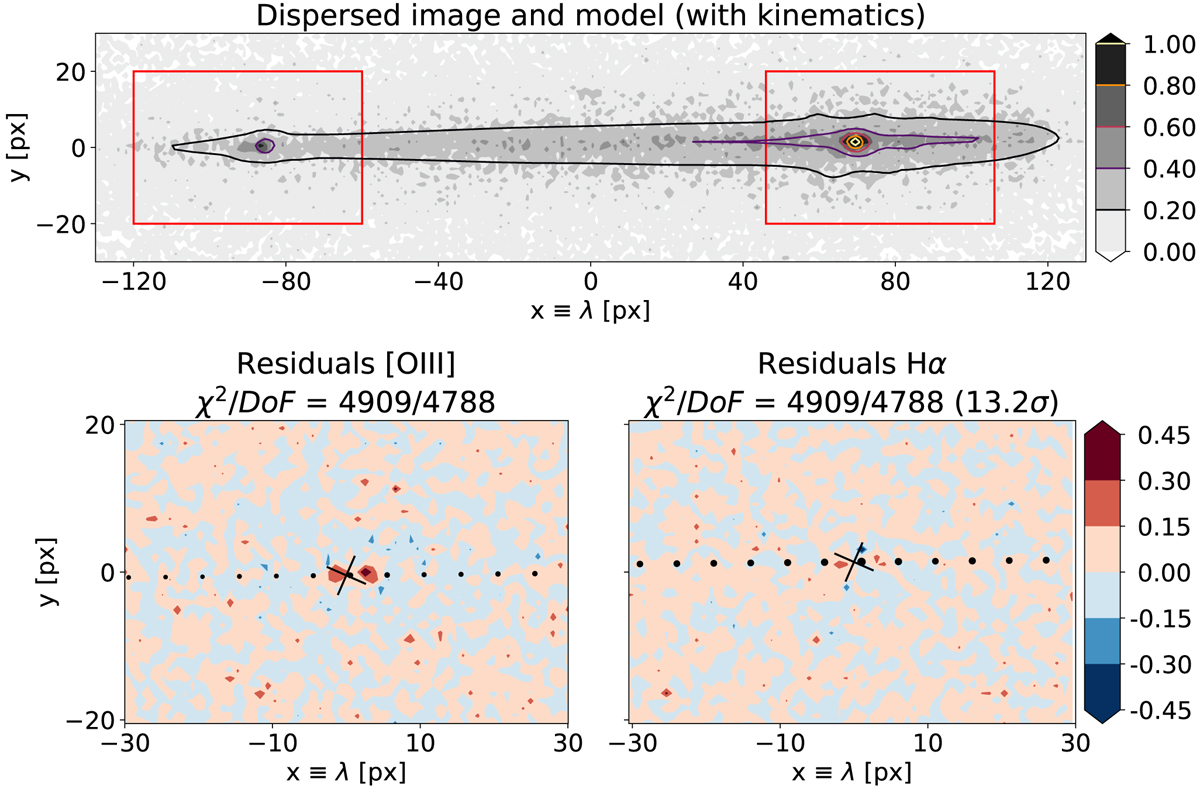
Top: input observed (gray) and modeled (contours) peak-normalized spectrogram of galaxy #451 from the GLASS survey for which Hα complex (right frame) and [O III] doublet (left frame) are simultaneously adjusted. Bottom: residual map for model with kinematics centered on [O III] doublet (left) and on Hα+[N II]+[S II] complex (right). The black crosses represent PA of the galaxy at [O III] and Hα emission line positions. The decrease in the total χ2 corresponds to a joint detection at 13.2σ.
Current usage metrics show cumulative count of Article Views (full-text article views including HTML views, PDF and ePub downloads, according to the available data) and Abstracts Views on Vision4Press platform.
Data correspond to usage on the plateform after 2015. The current usage metrics is available 48-96 hours after online publication and is updated daily on week days.
Initial download of the metrics may take a while.