Fig. 8.
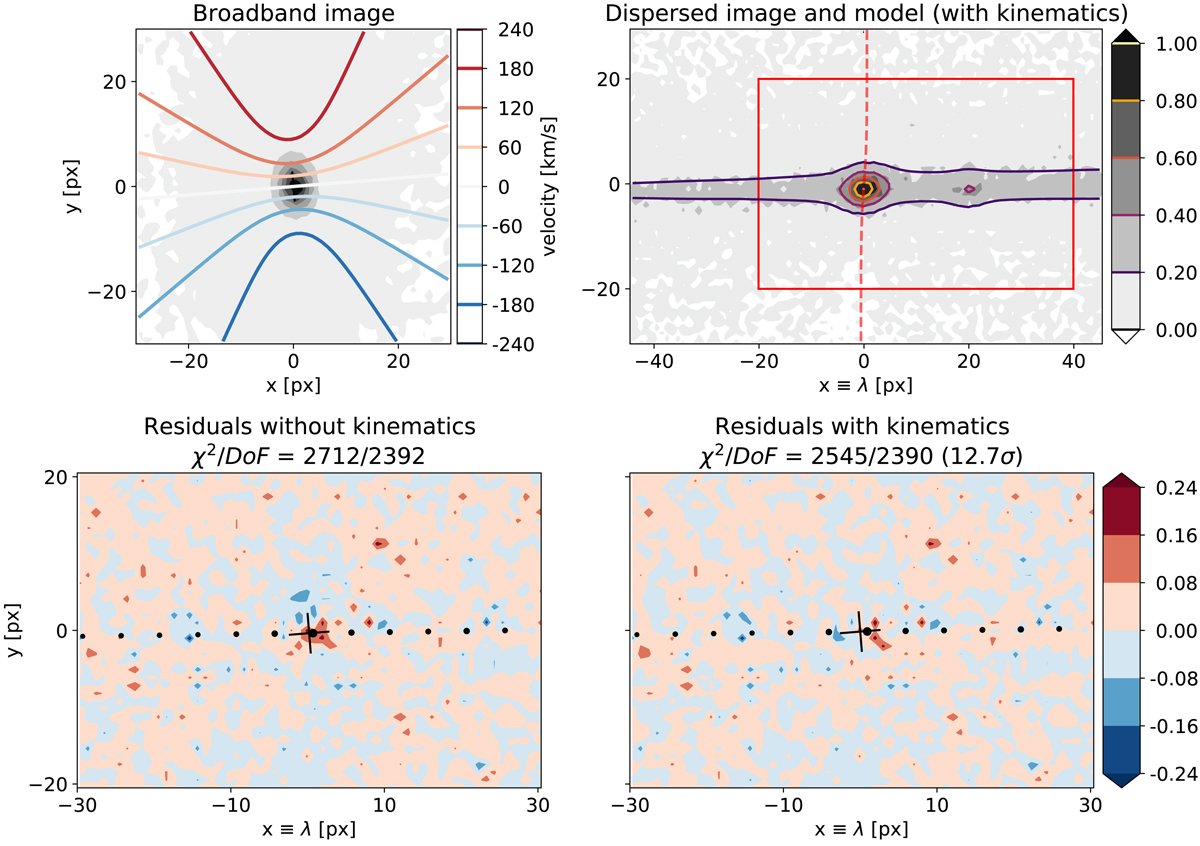
Top left: adjusted velocity field v(r) (contours) over-imposed on broadband image B(r) (gray) of galaxy #1134 from the GLASS survey. Top right: input observed (gray) and modeled (contours) peak-normalized spectrogram, centered on the Hα+[N II]+[S II] complex. Red dashed lines represent the adjusted rotation curve at the Hα position. Given the poor kinematic sampling, the offset induced by the kinematics is only ± ∼ 0.5 px. Bottom left: residual map for model without kinematics. Bottom right: residual map after adding kinematic parameters to the model. Black cross represents position angle of the galaxy at Hα emission line position and the dotted line the spectral trace. The decrease in the χ2 corresponds to a 12.7σ kinematic signature detection.
Current usage metrics show cumulative count of Article Views (full-text article views including HTML views, PDF and ePub downloads, according to the available data) and Abstracts Views on Vision4Press platform.
Data correspond to usage on the plateform after 2015. The current usage metrics is available 48-96 hours after online publication and is updated daily on week days.
Initial download of the metrics may take a while.