Fig. 6.
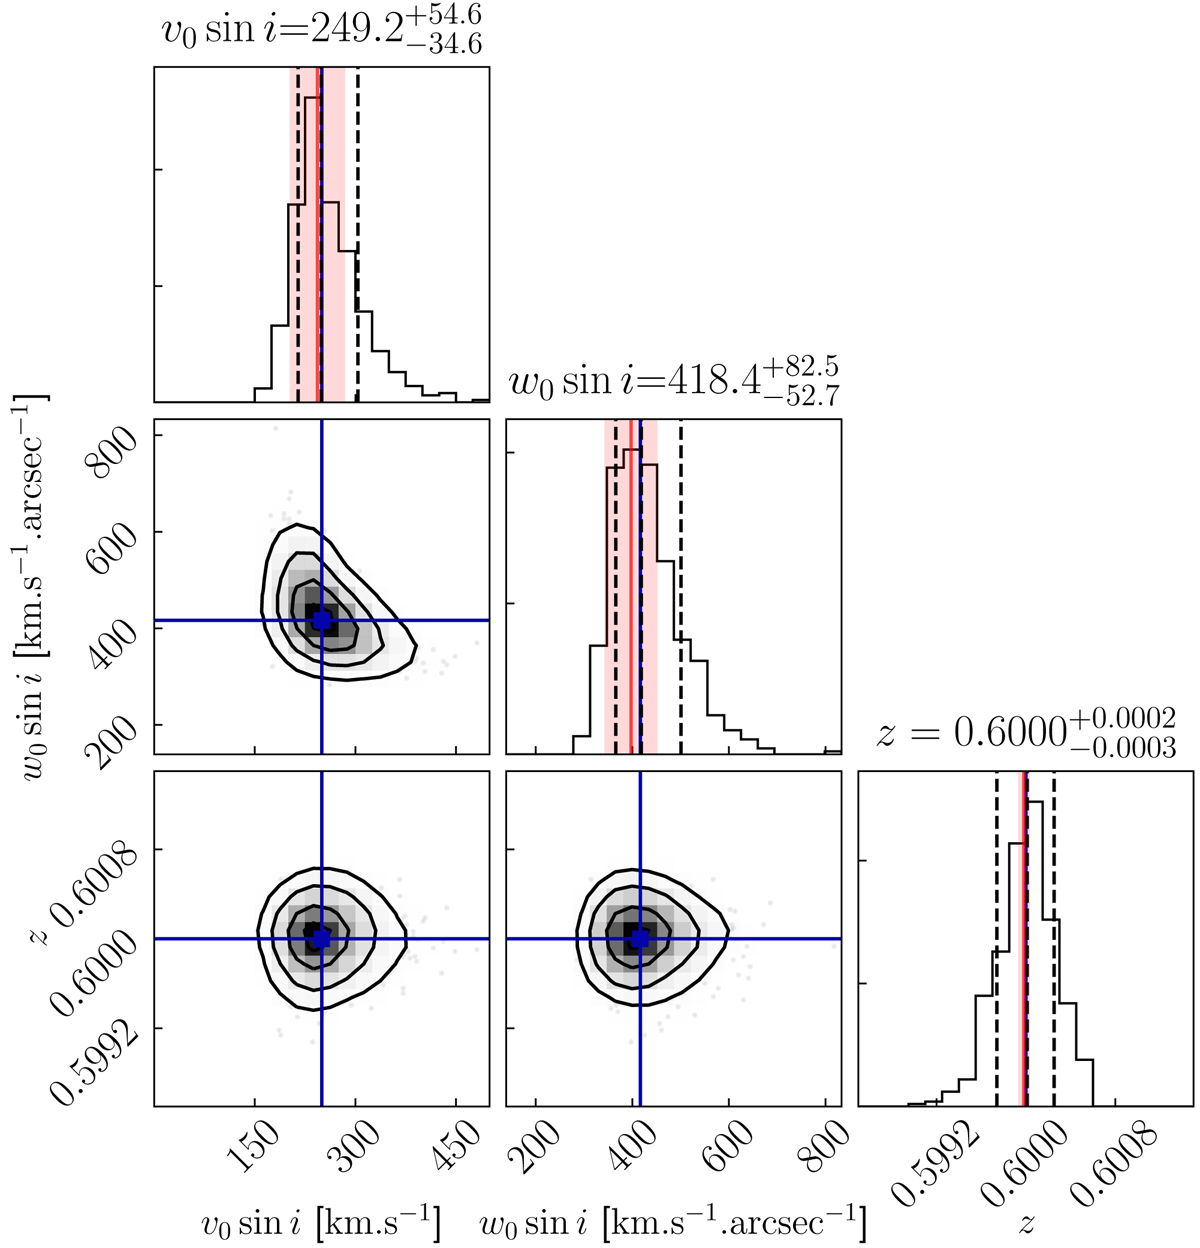
Marginalized distributions of kinematic parameters v0 sin i, w0 sin i and redshift z for 500 realizations of a Gaussian noise with PSNR of 40. Blue lines show input values for the simulation, the dashed lines show the 16th, 50th and 84th percentiles of the posterior distribution. Red lines (resp. shadded region) indicate fit result (resp. ±1σ error band) derived from the fiducial noise realization.
Current usage metrics show cumulative count of Article Views (full-text article views including HTML views, PDF and ePub downloads, according to the available data) and Abstracts Views on Vision4Press platform.
Data correspond to usage on the plateform after 2015. The current usage metrics is available 48-96 hours after online publication and is updated daily on week days.
Initial download of the metrics may take a while.