Fig. 4.
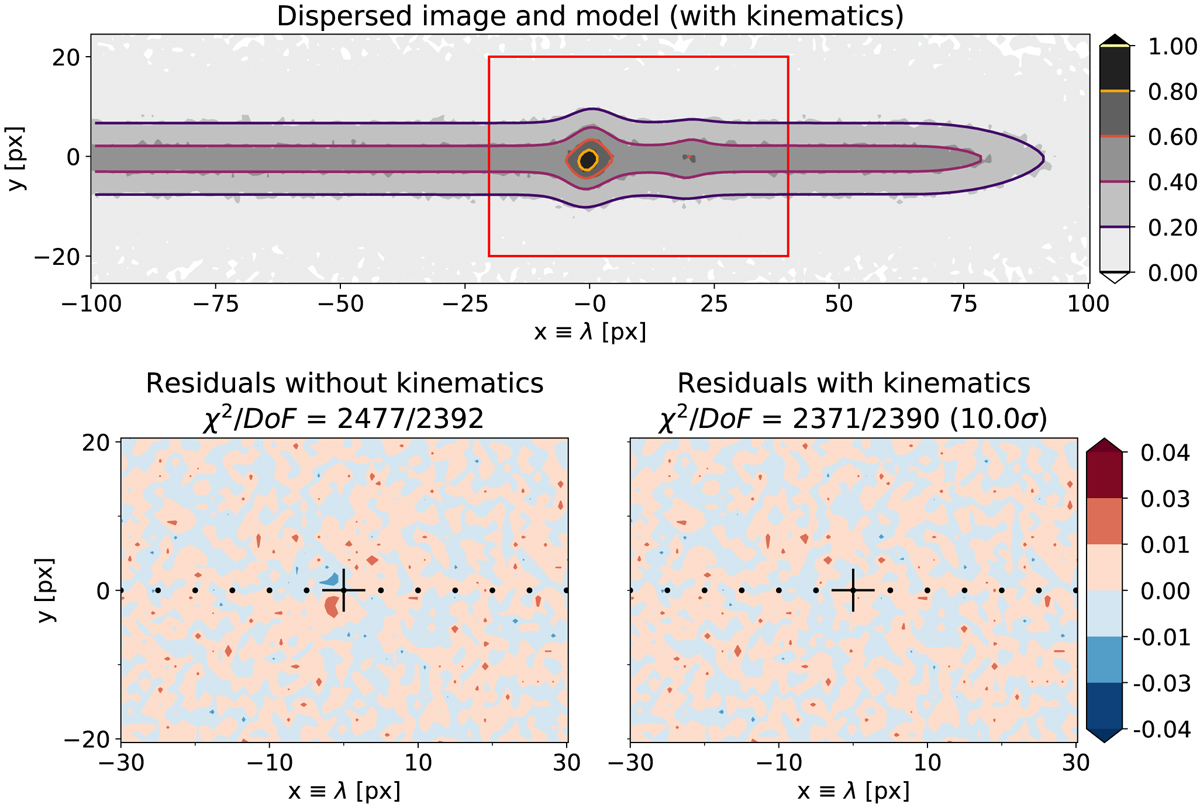
Top: input peak-normalized dispersed image data (gray) and model with kinematics (contours) adjusted on the fit region (rectangle). Bottom left: residual map for the model without kinematics, with a quadrupolar structure visible at Hα line location. Bottom right: residual map for model including kinematics. The cross represents the position and relative PA of the galaxy at Hα wavelength. The decrease in the χ2 with two additional kinematic parameters corresponds to a 10.0σ detection.
Current usage metrics show cumulative count of Article Views (full-text article views including HTML views, PDF and ePub downloads, according to the available data) and Abstracts Views on Vision4Press platform.
Data correspond to usage on the plateform after 2015. The current usage metrics is available 48-96 hours after online publication and is updated daily on week days.
Initial download of the metrics may take a while.