Fig. 1.
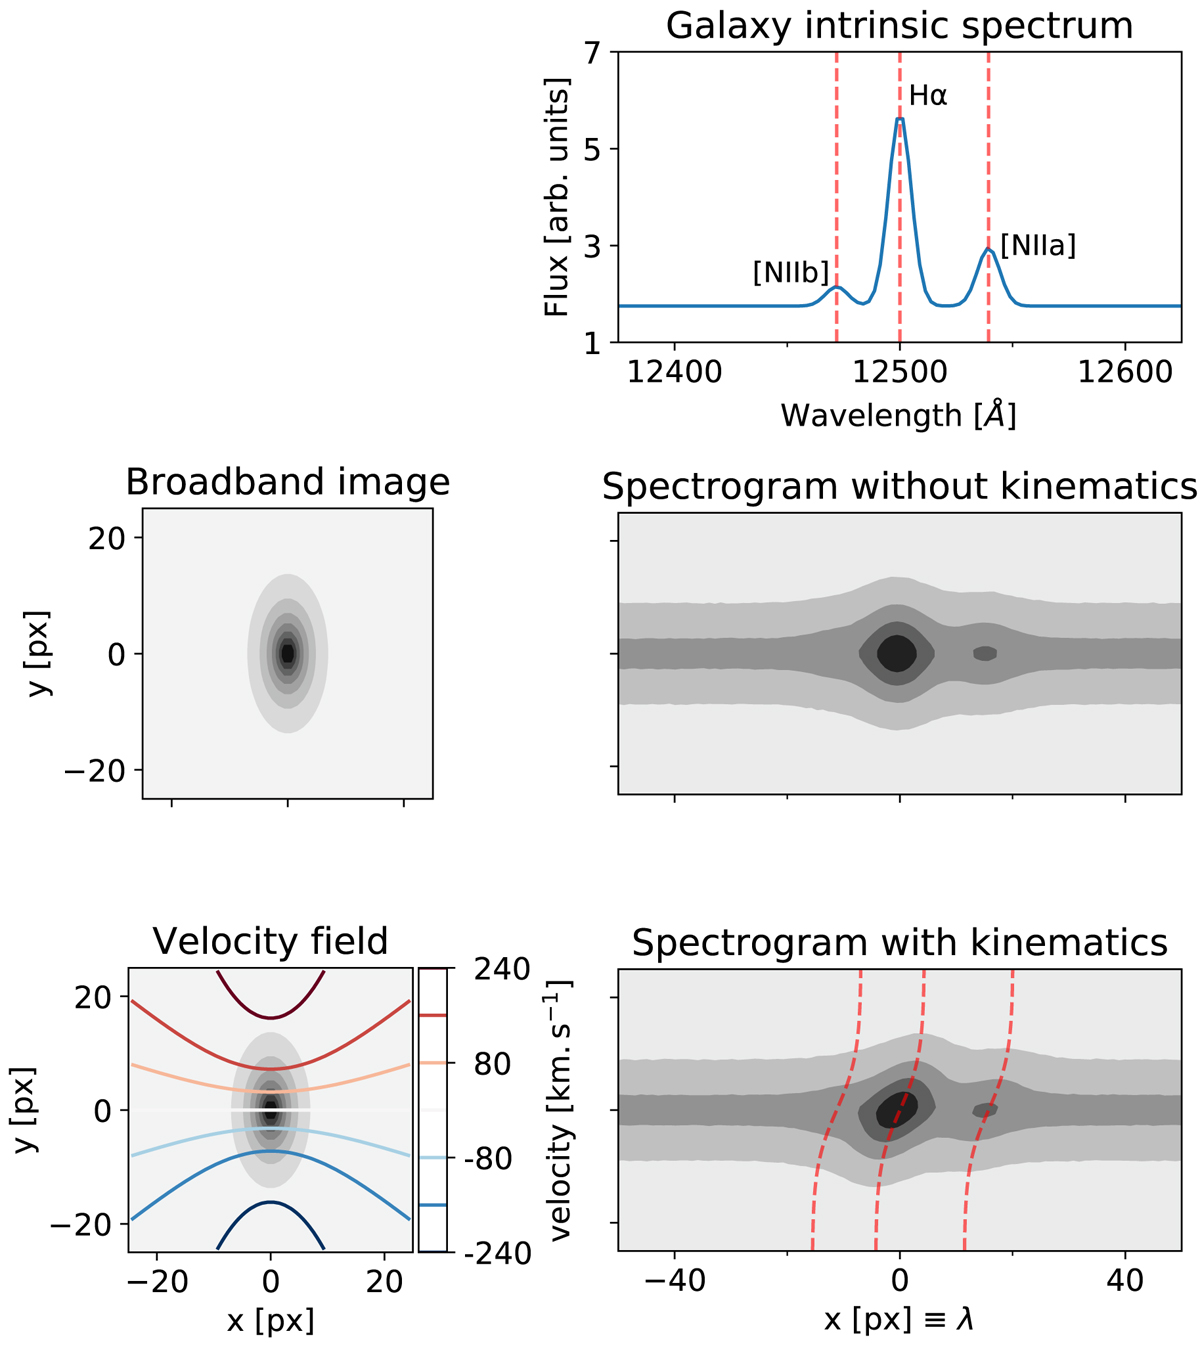
Toy simulation of spectrogram of typical Hα-emitting disk galaxy at z ∼ 0.9 (intrinsic spectrum in uppermost panel, spatial profile on the leftmost panels) as observed with an HST-like slitless spectrograph, but with an improved spectral resolution of ℛ ∼ 2500 (see text). Top: without kinematic effects; bottom: signature of the intrinsic velocity field is clearly visible as a distortion of the spectrogram. The red dashed lines correspond to the galaxy rotation curves at each emission lines’ position, and are tracing the distortion in the spectrogram.
Current usage metrics show cumulative count of Article Views (full-text article views including HTML views, PDF and ePub downloads, according to the available data) and Abstracts Views on Vision4Press platform.
Data correspond to usage on the plateform after 2015. The current usage metrics is available 48-96 hours after online publication and is updated daily on week days.
Initial download of the metrics may take a while.