Fig. 4.
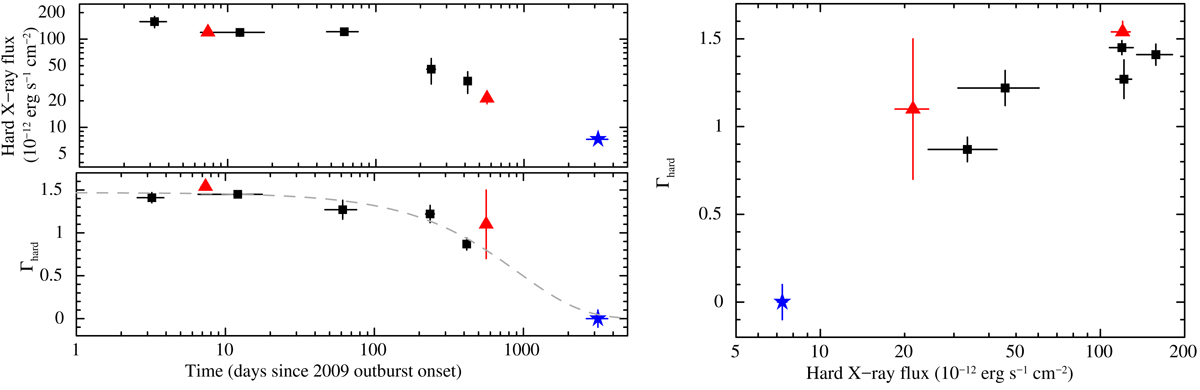
Left: time evolution of the flux in the 10–70 keV energy band (top) and of the PL photon index in the hard X-rays (bottom) of 1E 1547.0–5408 since the onset of the last outburst on 2009 January 22 at 00:53 UTC. Black squares refer to INTEGRAL data, red triangles refer to Suzaku data, the blue star refers to the merged NuSTAR observations presented in this study. All fluxes for archival observations were referred to the 10–70 keV band using PIMMS (https://heasarc.gsfc.nasa.gov/cgi-bin/Tools/w3pimms/w3pimms.pl), assuming the spectral shapes reported in Table 3 by Enoto et al. (2010), Table 8 by Kuiper et al. (2012) and Table 3 by Iwahashi et al. (2013). The dashed grey line in the bottom panel denotes the best-fitting exponential function for the time evolution of the photon index (see the text for details). Right: evolution of the PL photon index for the hard X-ray component as a function of the hard X-ray flux. Marks and colors are the same as in the left panel.
Current usage metrics show cumulative count of Article Views (full-text article views including HTML views, PDF and ePub downloads, according to the available data) and Abstracts Views on Vision4Press platform.
Data correspond to usage on the plateform after 2015. The current usage metrics is available 48-96 hours after online publication and is updated daily on week days.
Initial download of the metrics may take a while.