Fig. 2.
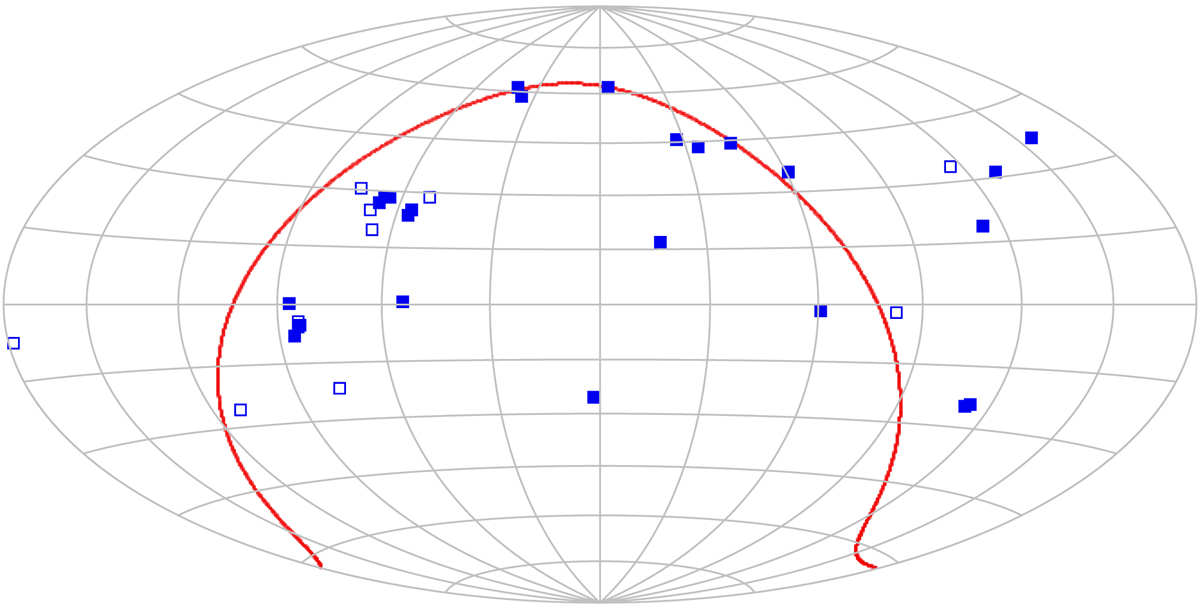
Sky distribution of the radio sources in Tables 1 and 2. Filled and open symbols mark the objects that were accepted and rejected in the baseline solution. The map is a Hammer–Aitoff projection in ICRS coordinates with α = δ = 0 in the centre, α increasing from right to left, and the Galactic equator is plotted in red.
Current usage metrics show cumulative count of Article Views (full-text article views including HTML views, PDF and ePub downloads, according to the available data) and Abstracts Views on Vision4Press platform.
Data correspond to usage on the plateform after 2015. The current usage metrics is available 48-96 hours after online publication and is updated daily on week days.
Initial download of the metrics may take a while.