Open Access
Fig. 3.
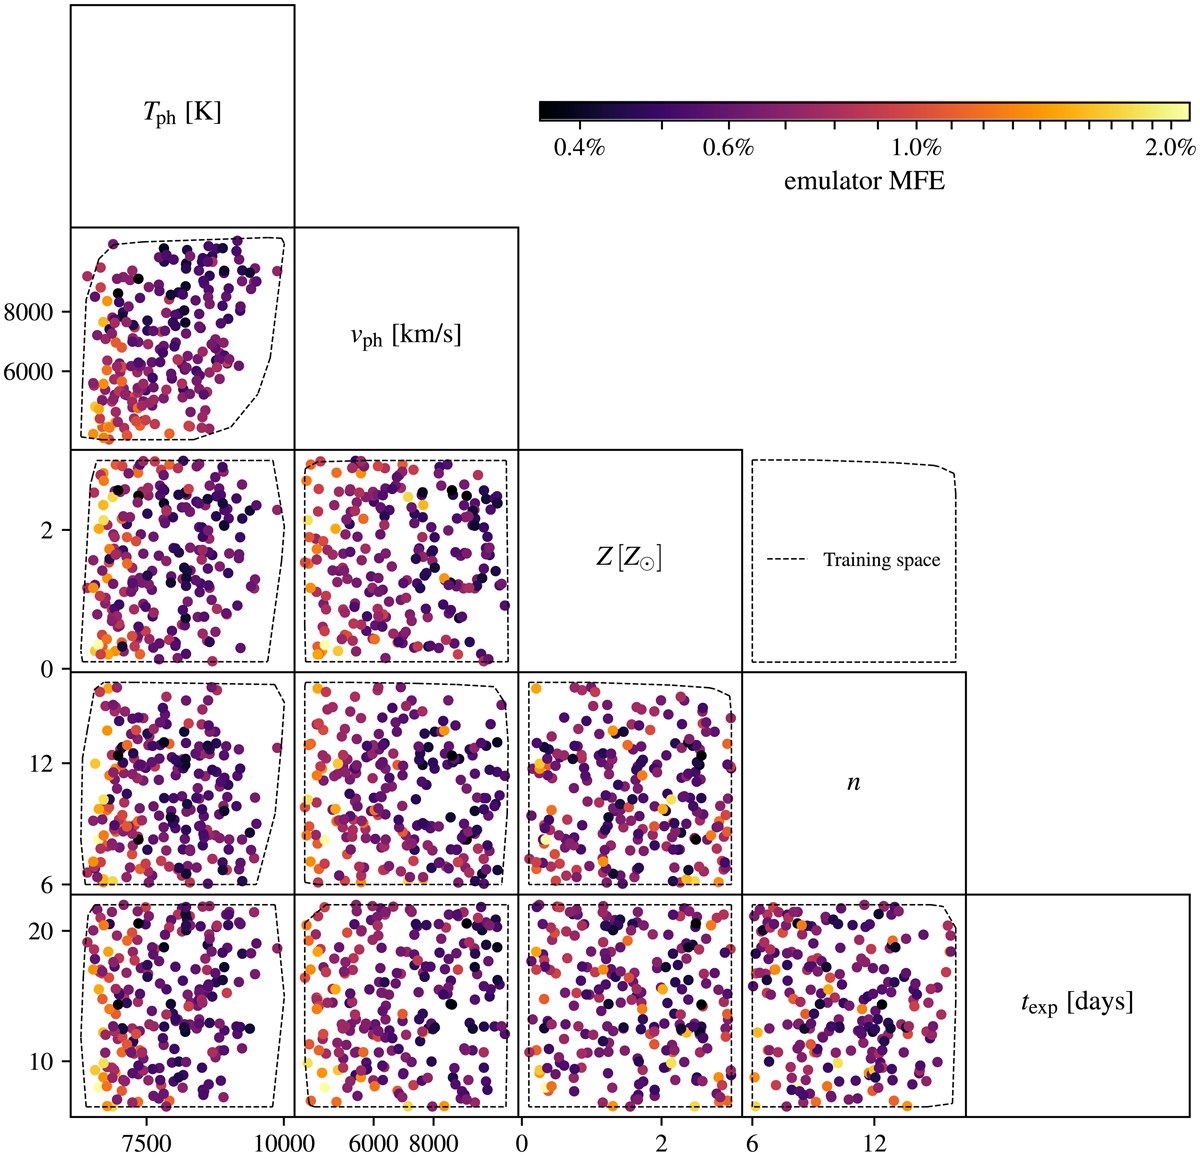
Test errors for the spectral emulator as a function of the input parameters. We show the color-coded MFE (see Eq. (7)) between emulated and simulated spectra for all two-dimensional projections of the test parameters. The region enclosed by the dashed black line indicates the parameter space covered by the training data.
Current usage metrics show cumulative count of Article Views (full-text article views including HTML views, PDF and ePub downloads, according to the available data) and Abstracts Views on Vision4Press platform.
Data correspond to usage on the plateform after 2015. The current usage metrics is available 48-96 hours after online publication and is updated daily on week days.
Initial download of the metrics may take a while.