Fig. 9.
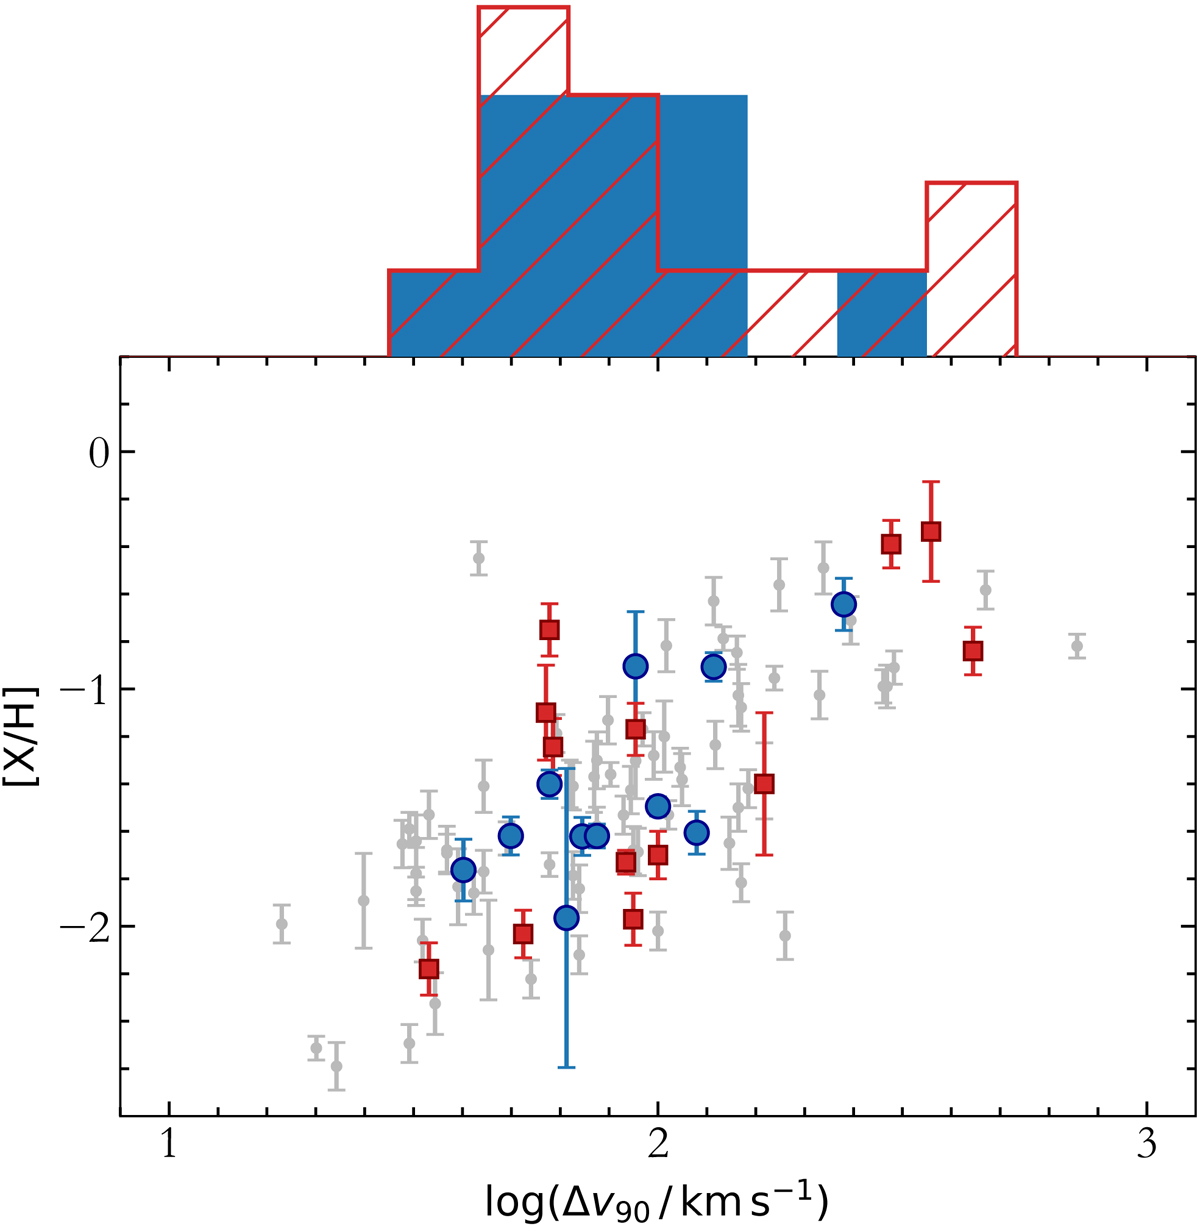
Comparison of the metallicities and Δv90 values of ESDLAs (blue circles) and GRB-DLAs (red squares) observed with X-shooter. For comparison, the grey points show the values for the overall intervening QSO-DLA population from Ledoux et al. (2006). The histograms in the top panel provide the Δv90 distributions of the two samples using the same colour-coding as in Fig. 8.
Current usage metrics show cumulative count of Article Views (full-text article views including HTML views, PDF and ePub downloads, according to the available data) and Abstracts Views on Vision4Press platform.
Data correspond to usage on the plateform after 2015. The current usage metrics is available 48-96 hours after online publication and is updated daily on week days.
Initial download of the metrics may take a while.