Fig. 4.
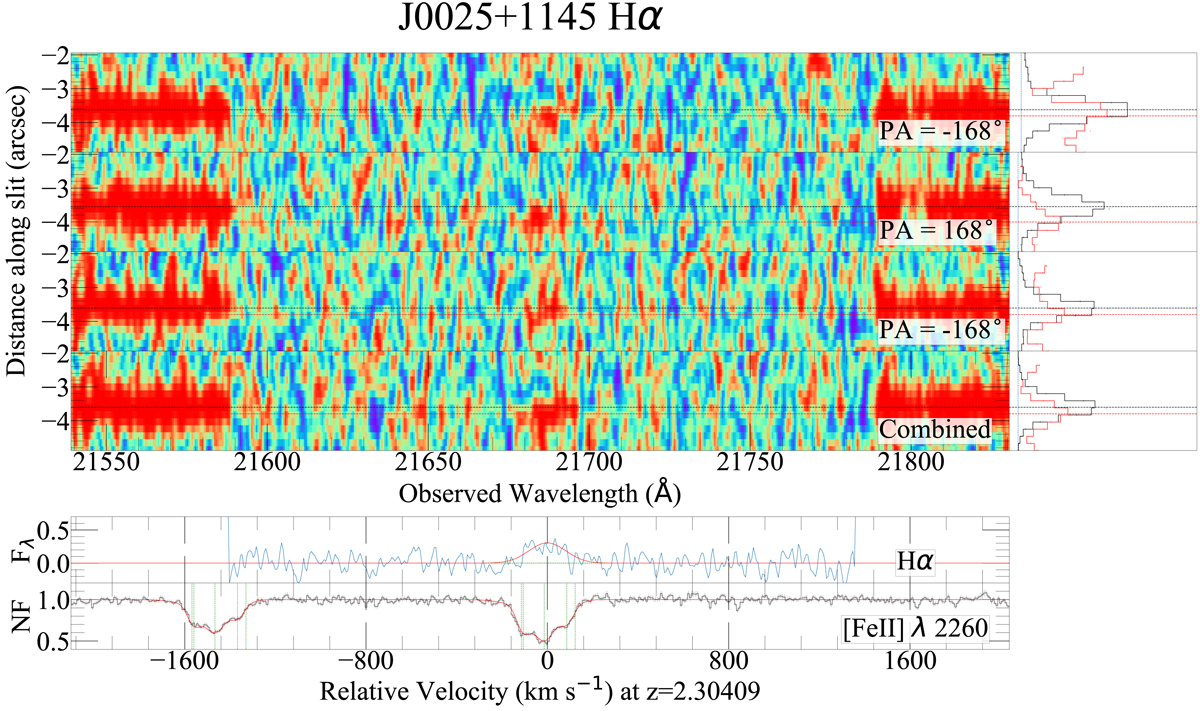
Detection of Hα emission associated with the zabs = 2.304 ESDLA towards J0025+1145. Top panels: three individual 2D spectra and the combination of all of them. The quasar trace has been removed over the central region (Δv ∼ 3000 km s−1). The Hα emission corresponds to the remaining blob in the centre of the images, and is quite evident in the combined 2D spectrum. The side panels show the spatial extent of the trace (black) and of the Hα emission (red) obtained by collapsing the 2D data along the wavelength axis. The location of their centroid (horizontal dotted lines) provides a measure of the impact parameter along the slit direction. The fifth panel shows the quasar-subtracted 1D data (in blue) summed over the spatial axis together with a Gaussian fit (in red) to the emission line. The normalised absorption profile of Fe IIλ2260 is shown in the bottom panel for comparison. The absorption seen at v ∼ −1600 km s−1 is due to Fe IIλ2249.
Current usage metrics show cumulative count of Article Views (full-text article views including HTML views, PDF and ePub downloads, according to the available data) and Abstracts Views on Vision4Press platform.
Data correspond to usage on the plateform after 2015. The current usage metrics is available 48-96 hours after online publication and is updated daily on week days.
Initial download of the metrics may take a while.