Fig. 3.
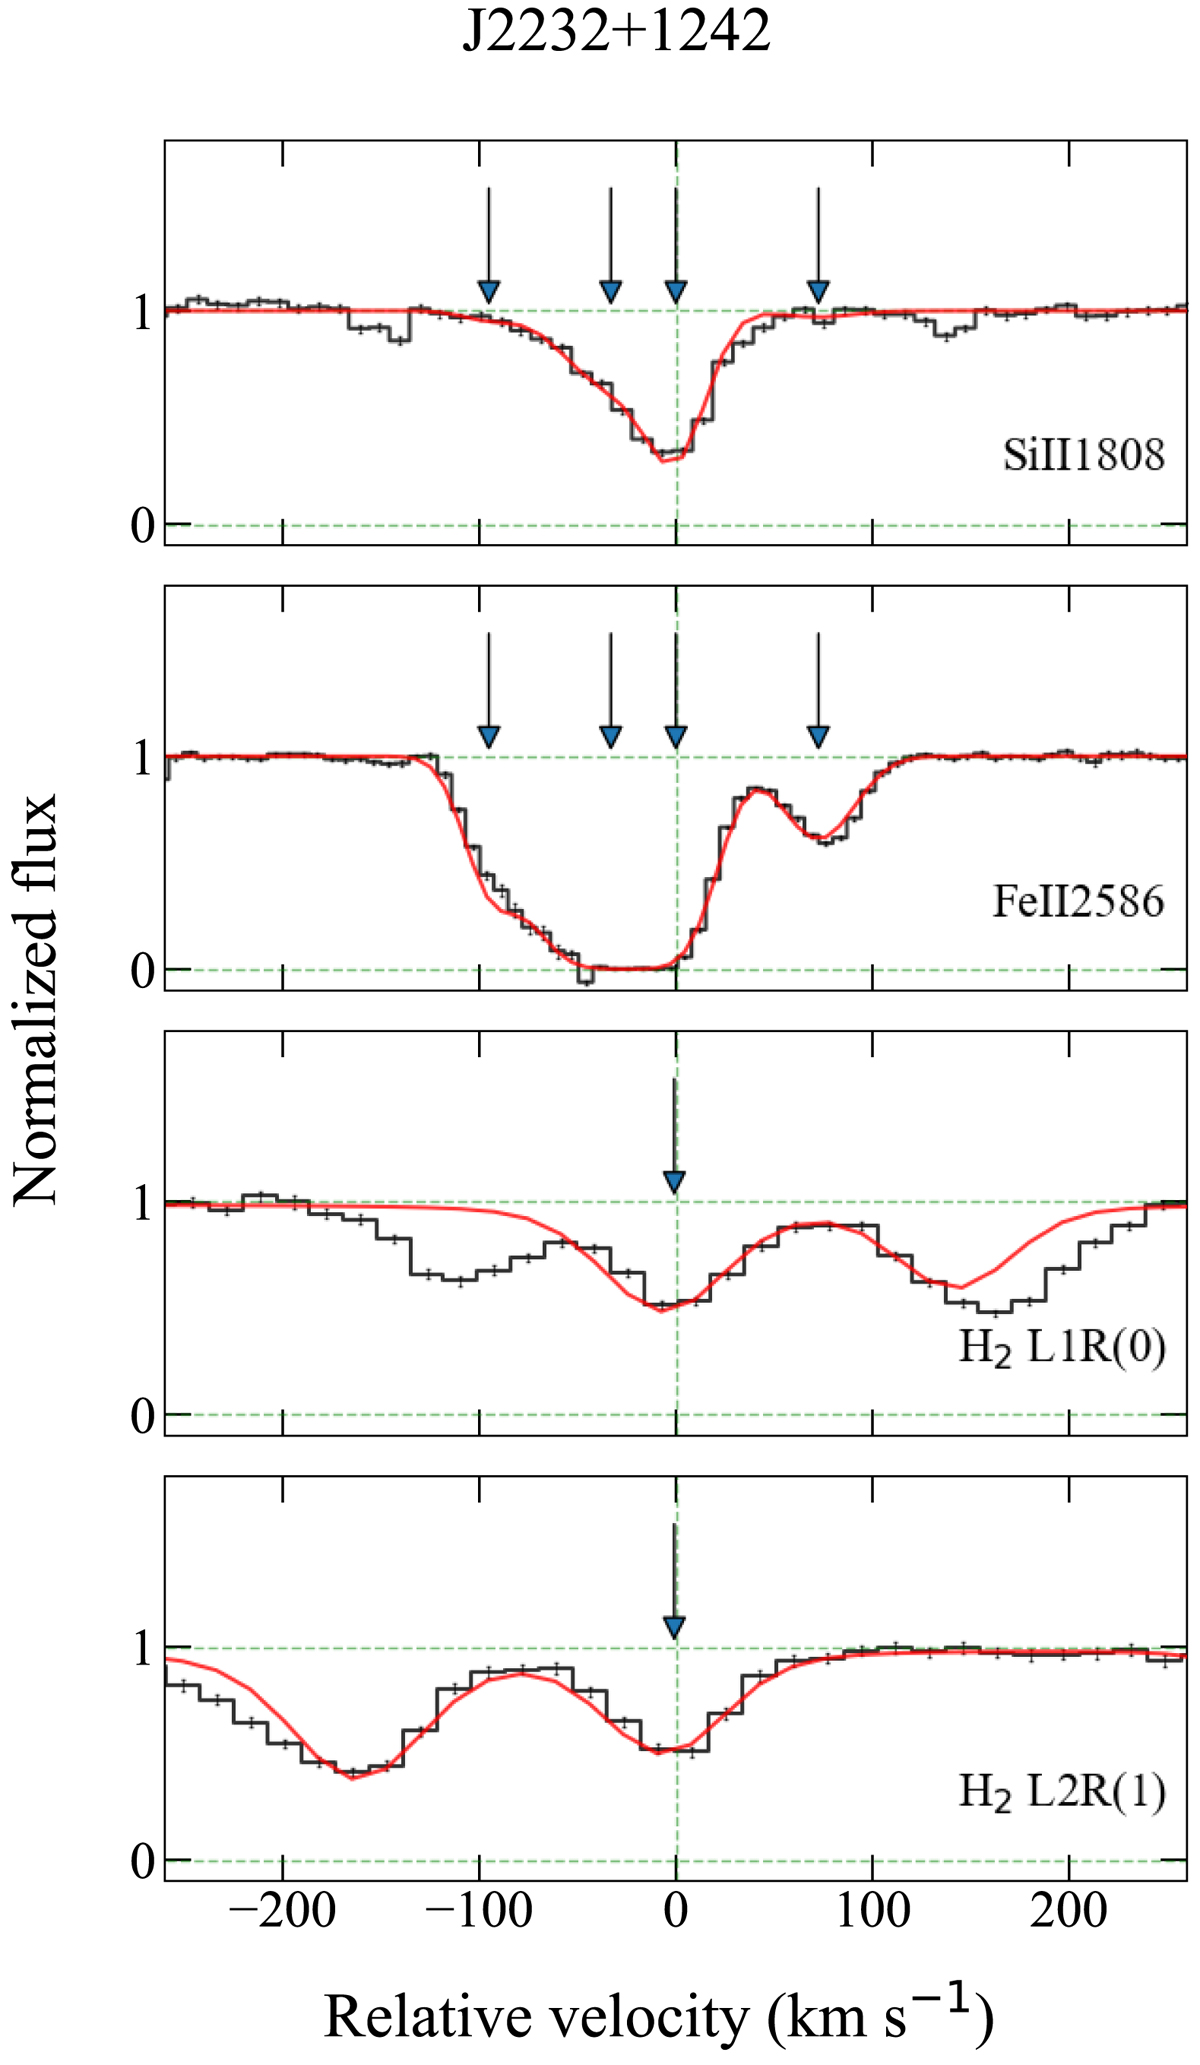
Velocity structure of metal lines tracing the overall neutral gas (top panels) compared with that seen in H2 (bottom panels), where the transition naming is “L” for Lyman, followed by the band number (vibrational level of the upper state), the branch (corresponding to the selection function), and the rotational level of the lower state in parentheses. Downward arrows indicate the positions of the different components in the best-fit model. The absorption seen at +150 km s−1 (−150 km s−1) in the L1R(0) (L2R(1)) panel is not an additional component but absorption from L1R(1) (L2R(0)). The zero of the velocity scale is set relative to the redshift of the strongest metal component.
Current usage metrics show cumulative count of Article Views (full-text article views including HTML views, PDF and ePub downloads, according to the available data) and Abstracts Views on Vision4Press platform.
Data correspond to usage on the plateform after 2015. The current usage metrics is available 48-96 hours after online publication and is updated daily on week days.
Initial download of the metrics may take a while.