Fig. A.18.
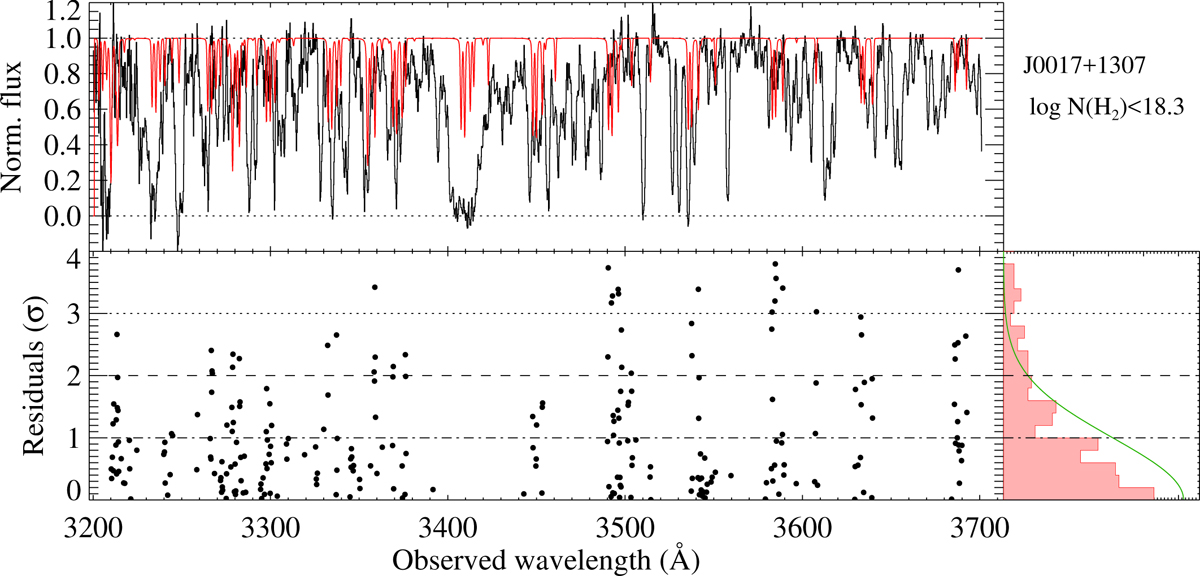
Top panel: normalised spectrum of J0017+1307 over the absorber H2 Lyman-Werner band region (black) together with the synthetic profile corresponding to the maximum N(H2) that is still consistent with the data. Bottom panel: positive residuals expressed in units of standard deviation as derived from the error spectrum, with the corresponding distribution shown in the right panel (red histogram). The green line corresponds to the expected Gaussian distribution of the residuals.
Current usage metrics show cumulative count of Article Views (full-text article views including HTML views, PDF and ePub downloads, according to the available data) and Abstracts Views on Vision4Press platform.
Data correspond to usage on the plateform after 2015. The current usage metrics is available 48-96 hours after online publication and is updated daily on week days.
Initial download of the metrics may take a while.