Fig. A.14.
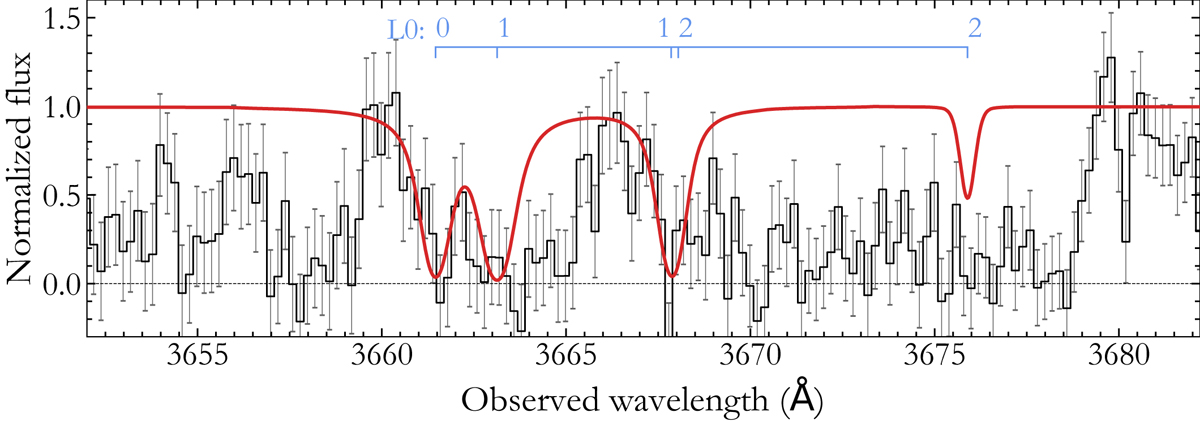
Portion of the X-shooter spectrum of J 0025+1145 covering the L0-band absorption lines of H2 from the DLA at z = 2.304(2). The rotational levels J are indicated above each blue tick mark. The normalised spectrum is shown in black, and the synthetic profile with total H2 column density log N(H2) = 20.1 is over-plotted in red.
Current usage metrics show cumulative count of Article Views (full-text article views including HTML views, PDF and ePub downloads, according to the available data) and Abstracts Views on Vision4Press platform.
Data correspond to usage on the plateform after 2015. The current usage metrics is available 48-96 hours after online publication and is updated daily on week days.
Initial download of the metrics may take a while.