Fig. 2.
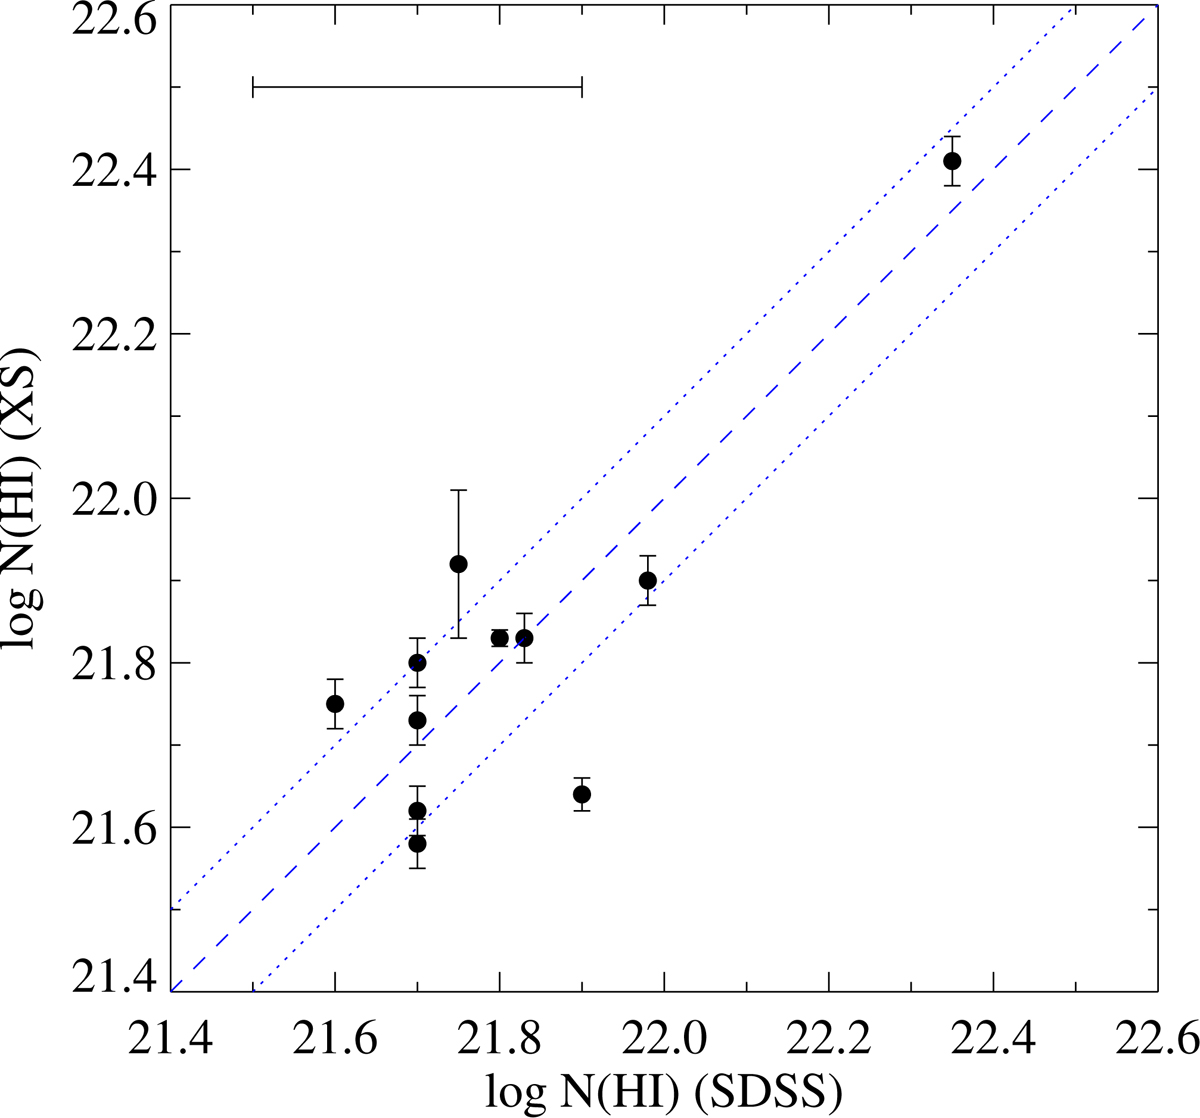
Comparison of H I column densities measured in our sample of 11 systems observed with X-shooter to those originally obtained from the low-resolution, low S/N SDSS data. The horizontal bar in the upper left corner shows the typical uncertainty of SDSS measurements. The dashed line shows the one-to-one relation, with dotted lines showing ±0.1 dex around this relation.
Current usage metrics show cumulative count of Article Views (full-text article views including HTML views, PDF and ePub downloads, according to the available data) and Abstracts Views on Vision4Press platform.
Data correspond to usage on the plateform after 2015. The current usage metrics is available 48-96 hours after online publication and is updated daily on week days.
Initial download of the metrics may take a while.