Fig. A.1.
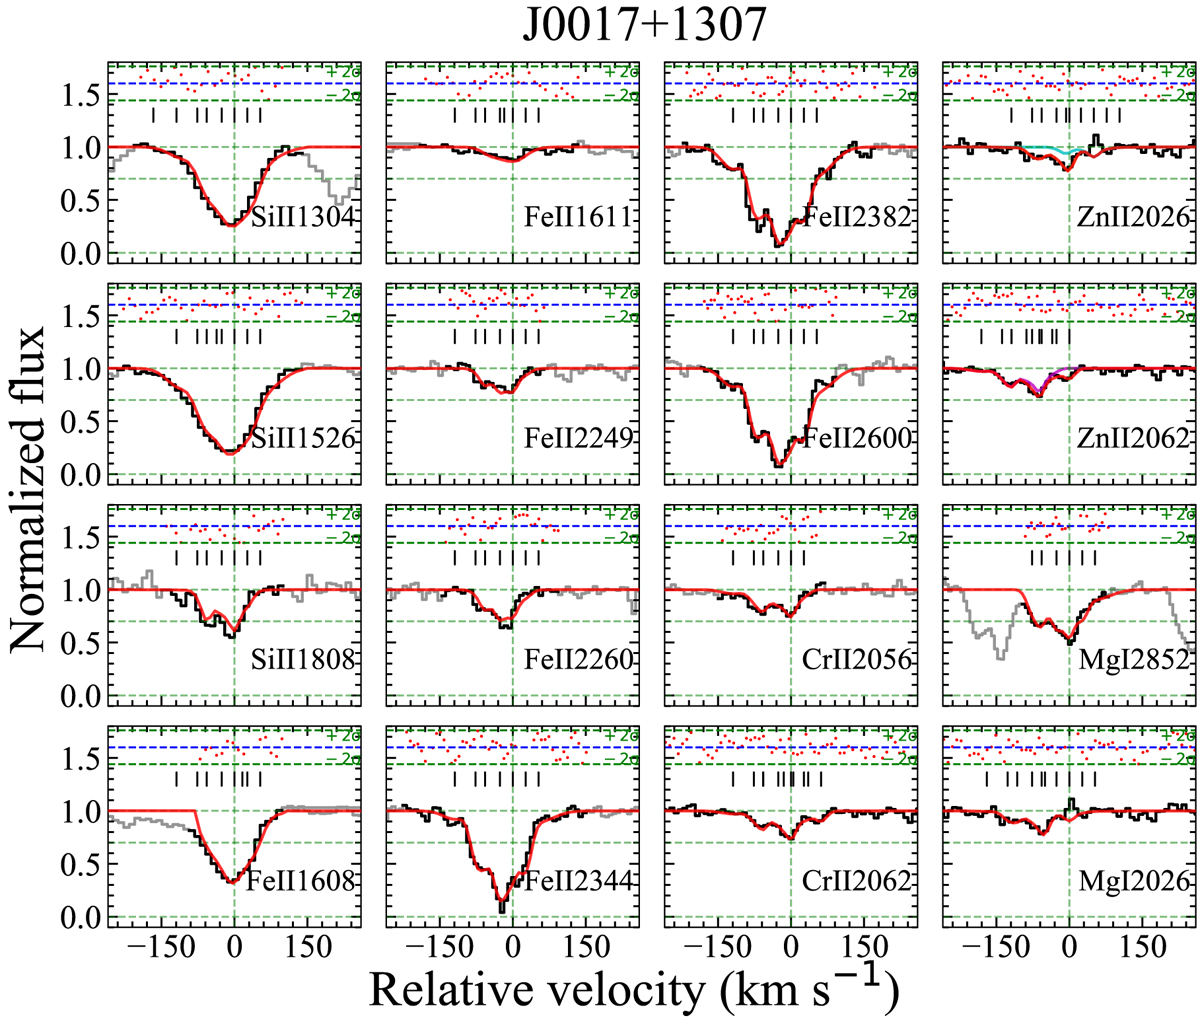
Low-ionisation metal lines associated with the zabs = 2.326 system towards J0017+1307. The normalised X-shooter spectrum is shown in grey with the best-fit multi-component Voigt profile over-plotted in red. Dark points show the data that constrain the fit. Short vertical marks show the location of the different velocity components. The panels showing Zn IIλ2026 and Zn IIλ2062 are over-plotted with a cyan and magenta line, showing contributions from Mg Iλ2026 and Cr IIλ2062, respectively. Finally, the residuals are shown above each line in units of the standard deviation (from the error spectrum).
Current usage metrics show cumulative count of Article Views (full-text article views including HTML views, PDF and ePub downloads, according to the available data) and Abstracts Views on Vision4Press platform.
Data correspond to usage on the plateform after 2015. The current usage metrics is available 48-96 hours after online publication and is updated daily on week days.
Initial download of the metrics may take a while.