Fig. 10.
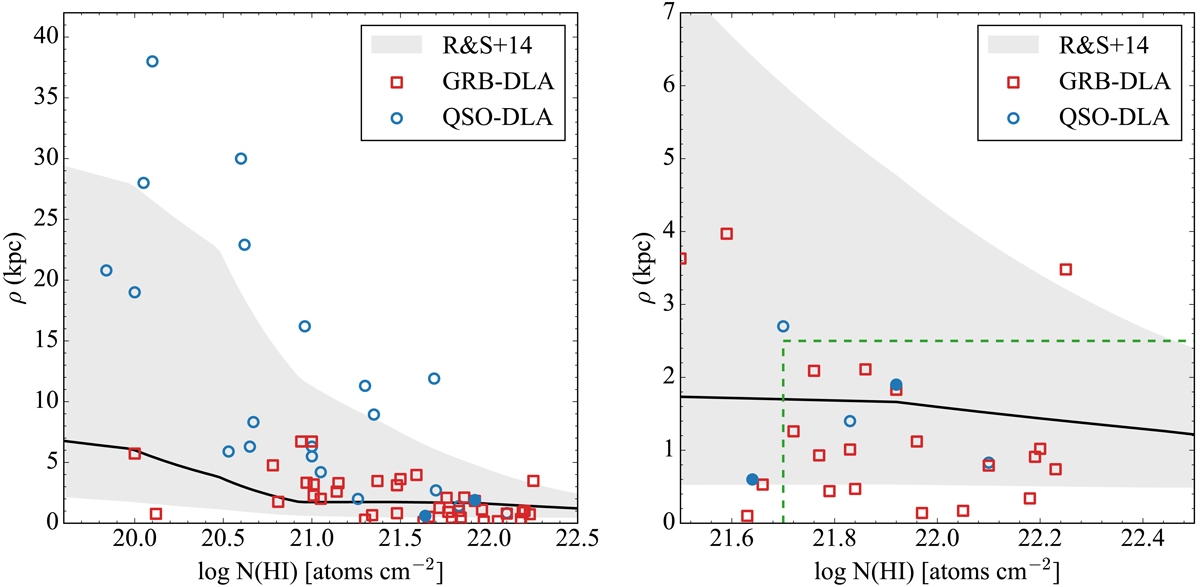
Impact parameter, ρ, vs. the neutral hydrogen column density, log N(H I), measured along the line of sight. Systems associated with the generic population of QSO-DLAs are plotted as blue circles (from Bouché et al. 2013; Fynbo et al. 2011, 2013; Hartoog et al. 2015; Kashikawa et al. 2014; Krogager et al. 2012, 2013, 2017; Ma et al. 2018; Møller & Warren 1993; Møller et al. 2004; Neeleman et al. 2018; Noterdaeme et al. 2012; Srianand et al. 2016; Ranjan et al. 2018; Rudie et al. 2017; Warren et al. 2001; Weatherley et al. 2005; Zafar et al. 2017), and the two new detections presented here are shown as filled circles. Values corresponding to GRB-DLAs are plotted as red squares. The grey line with the shaded region shows the predicted median and the 68% region from simulations by Rahmati & Schaye (2014). Right panel: zoom-in around the high column density region. The extent of the y-axis corresponds to the impact parameter out to which we uniformly cover the area around the quasar, which is determined by the slit width of our observations. The dashed green rectangle shows the region of typical impact parameters derived by Noterdaeme et al. (2014) for log N(H I) > 21.7 systems (see text).
Current usage metrics show cumulative count of Article Views (full-text article views including HTML views, PDF and ePub downloads, according to the available data) and Abstracts Views on Vision4Press platform.
Data correspond to usage on the plateform after 2015. The current usage metrics is available 48-96 hours after online publication and is updated daily on week days.
Initial download of the metrics may take a while.