Fig. 3
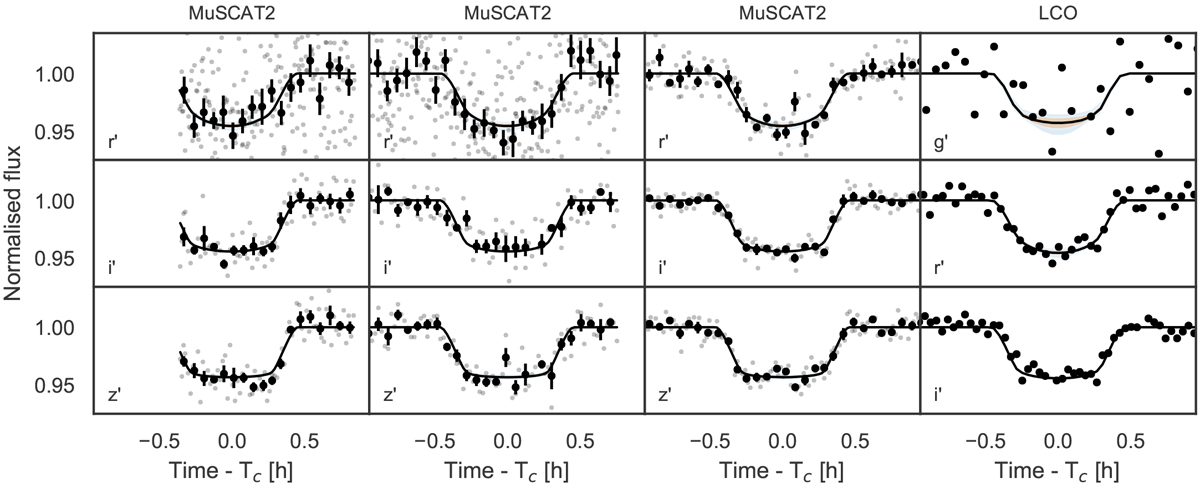
Three transits of TOI 263.01 observed simultaneously in r′, i′, and zs with MuSCAT2, and three separate transits observed with SINISTRO. Each column shows a separate observing night and each row a separate filter for MuSCAT2 observations, while each column shows a separate transit observed in a separate filter for the LCO data. MuSCAT2 photometry is shown with the original cadences (light grey points) and binned into four-minute bins shown as black points with error bars showing the standard error of the mean. The LCOGT observationsare not binned due to the longer exposure times. The median baseline model has been subtracted from the photometry,and the black lines show the median posterior transit model.
Current usage metrics show cumulative count of Article Views (full-text article views including HTML views, PDF and ePub downloads, according to the available data) and Abstracts Views on Vision4Press platform.
Data correspond to usage on the plateform after 2015. The current usage metrics is available 48-96 hours after online publication and is updated daily on week days.
Initial download of the metrics may take a while.