Fig. 2
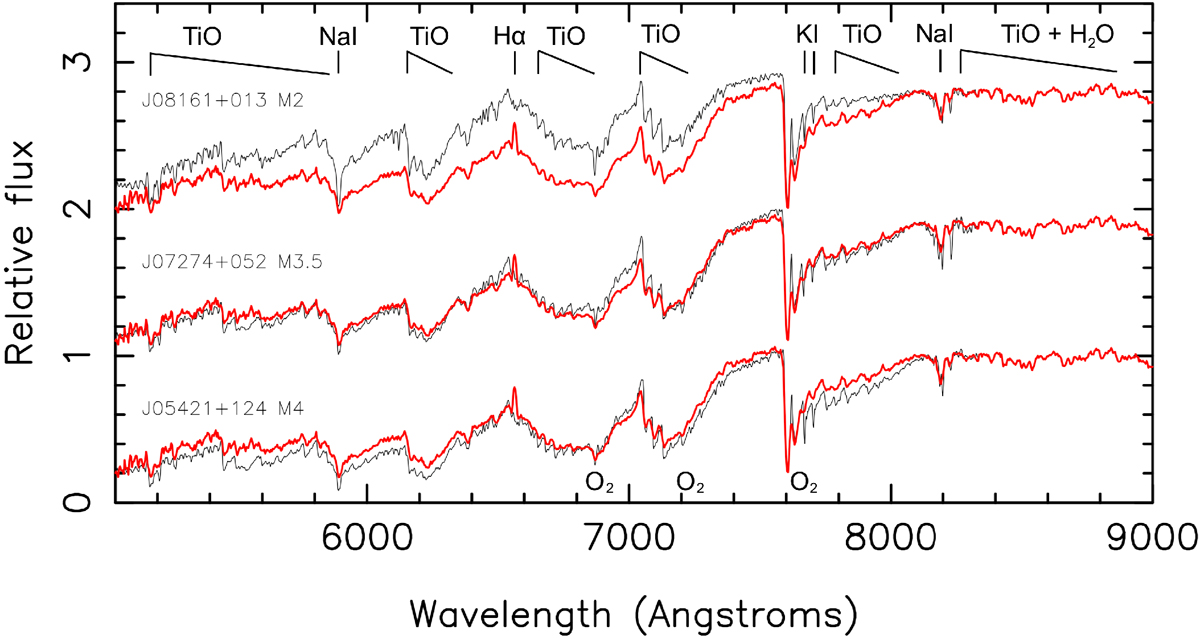
ALFOSC spectrum of TOI 263 with a resolution of 16.6 Å is plotted as a red line. It is compared to the spectra of three spectral standard stars from the catalogue of Alonso-Floriano et al. (2015), which are shown with a black line: GJ 2066 (J08161+013, M2V), Luyten’s star (J07274+052, M3.5V), and V1352 Ori (J05421+124, M4V). All spectra are normalised to 1.0 at the red continuum of the subordinate Na I lines, and are shifted vertically by 1.0 for clarity. The strongest molecular and atomic features are indicated on the top. The strongest telluric oxygen features are also labelled.
Current usage metrics show cumulative count of Article Views (full-text article views including HTML views, PDF and ePub downloads, according to the available data) and Abstracts Views on Vision4Press platform.
Data correspond to usage on the plateform after 2015. The current usage metrics is available 48-96 hours after online publication and is updated daily on week days.
Initial download of the metrics may take a while.