Fig. 6.
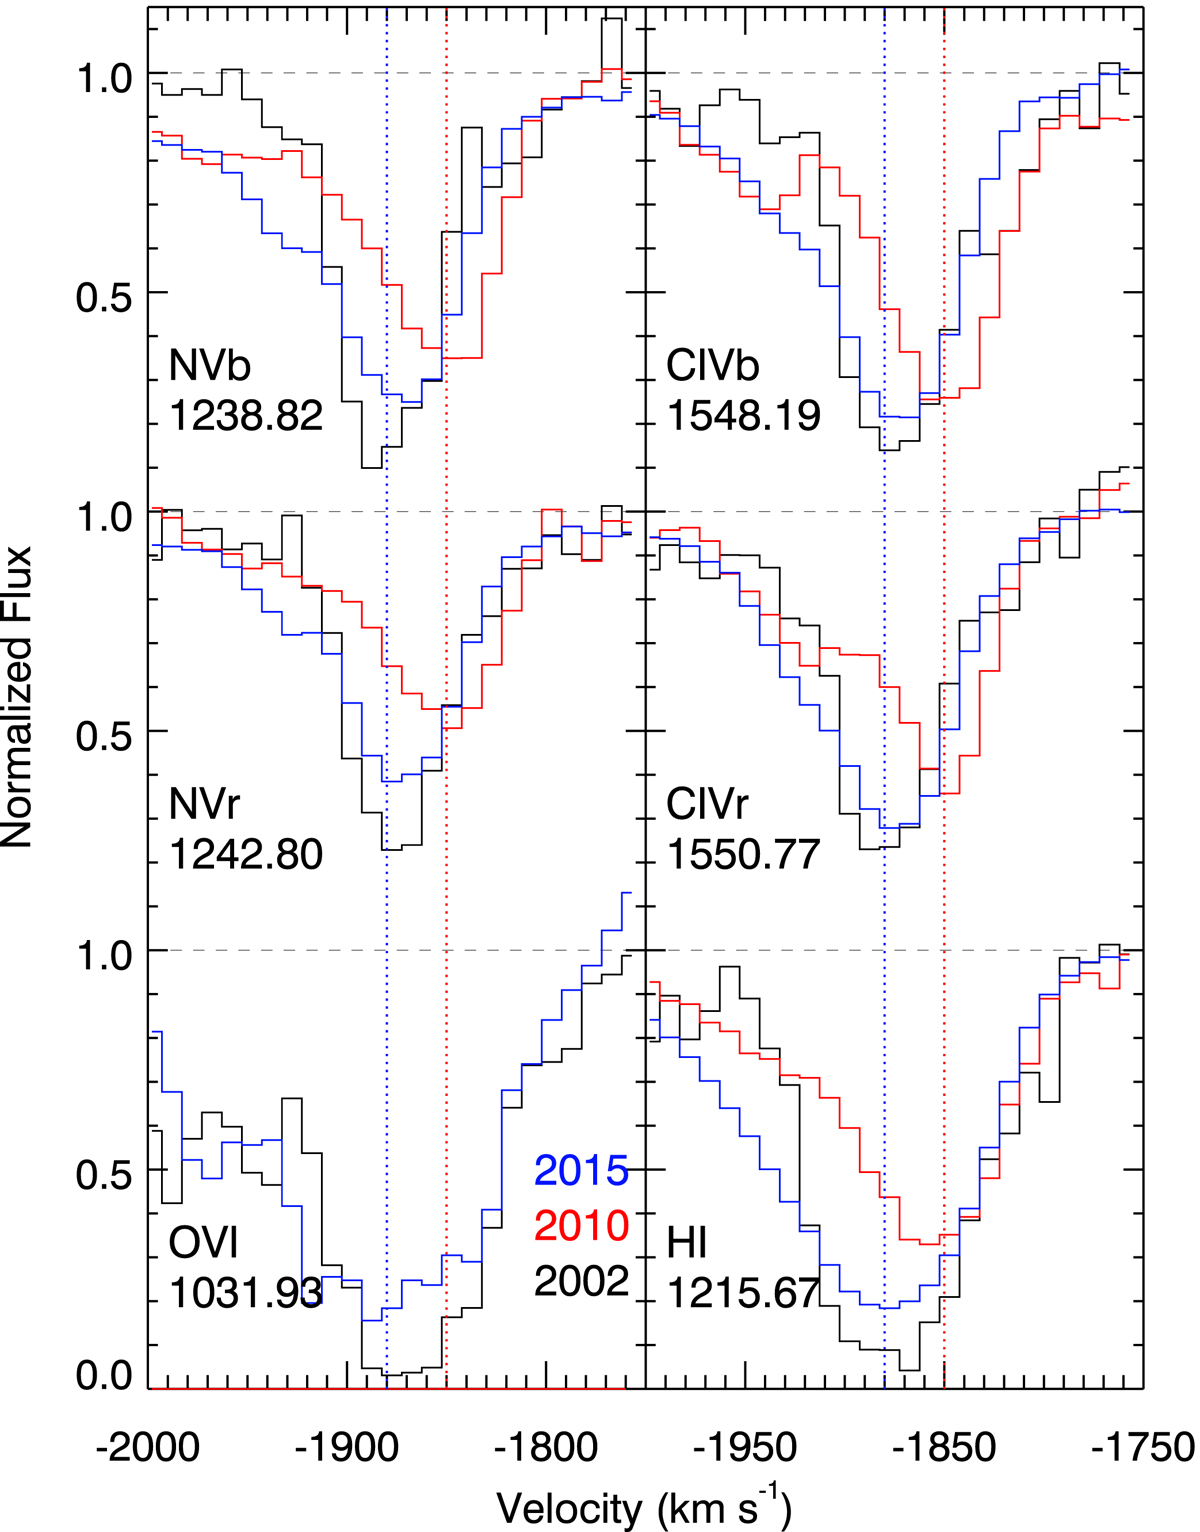
Component 3 variations: normalized spectrum showing the velocity-shift anomaly in the 2010 epoch. We illustrate this anomaly in outflow component 3 by showing vertical dotted lines through the centroid of the absorption troughs in the 2002 and 2015 epochs (blue) and during the 2010 epoch (red). We note that the overall depth of component 3 is lowest in the 2010 epoch in all of the observed troughs.
Current usage metrics show cumulative count of Article Views (full-text article views including HTML views, PDF and ePub downloads, according to the available data) and Abstracts Views on Vision4Press platform.
Data correspond to usage on the plateform after 2015. The current usage metrics is available 48-96 hours after online publication and is updated daily on week days.
Initial download of the metrics may take a while.