Fig. 5.
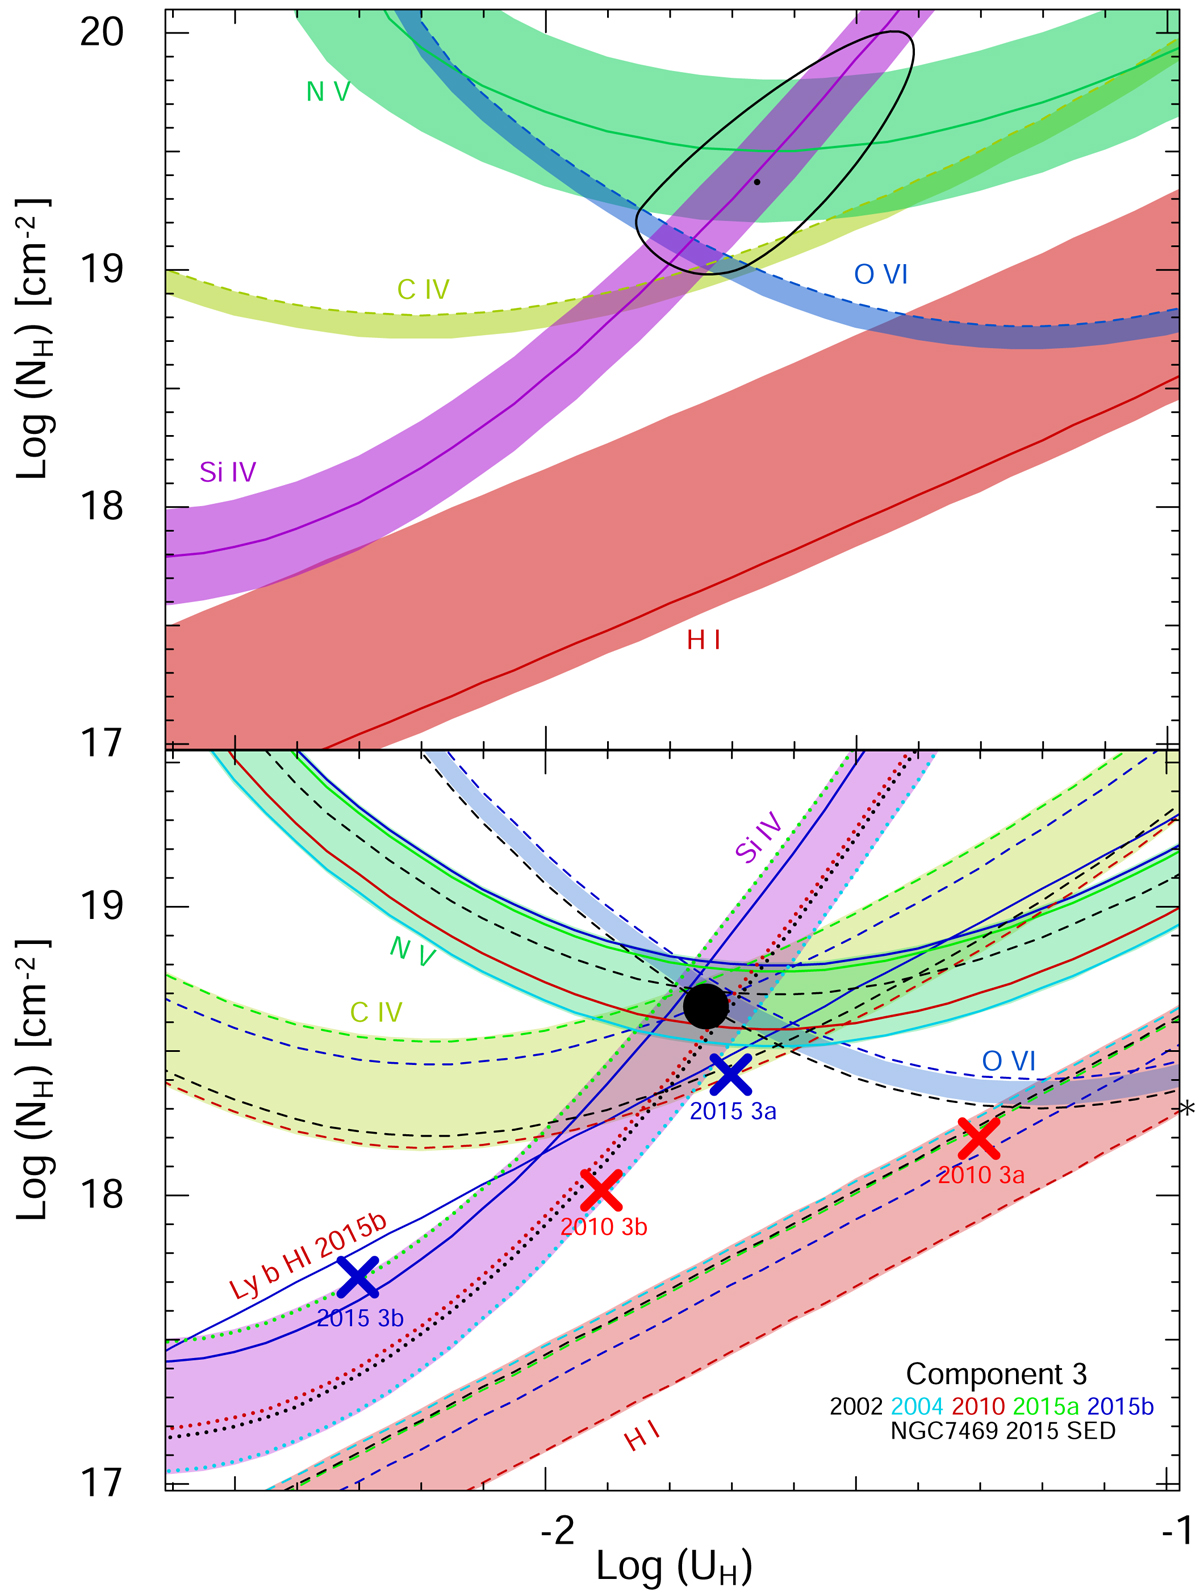
Top panel: photoionization phase plot showing the ionization solution for component 3 of epoch 2015b. We use the 2015 NGC 7469 SED and proto-solar metallicity. Solid lines and associated colored bands represent the locus of UH, NH models, which predict the measured Nion, and their 1σ uncertainties, while the dashed line is the lower limit on the O VI column-density that permits the phase-space above it. The black dot is the best χ2 solution and is surrounded by a 1σχ2 black contour. Bottom panel: component 3 multi-epoch photoionization phase plot, using the same enhanced metallicity we used for component 1. Measurements are shown as solid lines, lower limits as dashed lines, and upper limits as dotted lines. The measurements and limits are colored according to epoch of observation. The colored bands envelop measurements and limits for the same ion. For clarity’s sake, we do not show the errors on individual measurements (which are shown in the top panel for the 2015b epoch and are representative to all epochs). The nominal solution that satisfies all the Nion constraints for the 2015b epoch is shown by the black circle. In Sect. 4.3.2 we describe a 2-phase model for fitting the variability seen in component 3. We show the UH and NH positions of these phases (3a and 3b) for the 2010 and 2015 epochs with red and blue “X” symbols.
Current usage metrics show cumulative count of Article Views (full-text article views including HTML views, PDF and ePub downloads, according to the available data) and Abstracts Views on Vision4Press platform.
Data correspond to usage on the plateform after 2015. The current usage metrics is available 48-96 hours after online publication and is updated daily on week days.
Initial download of the metrics may take a while.