Fig. 9.
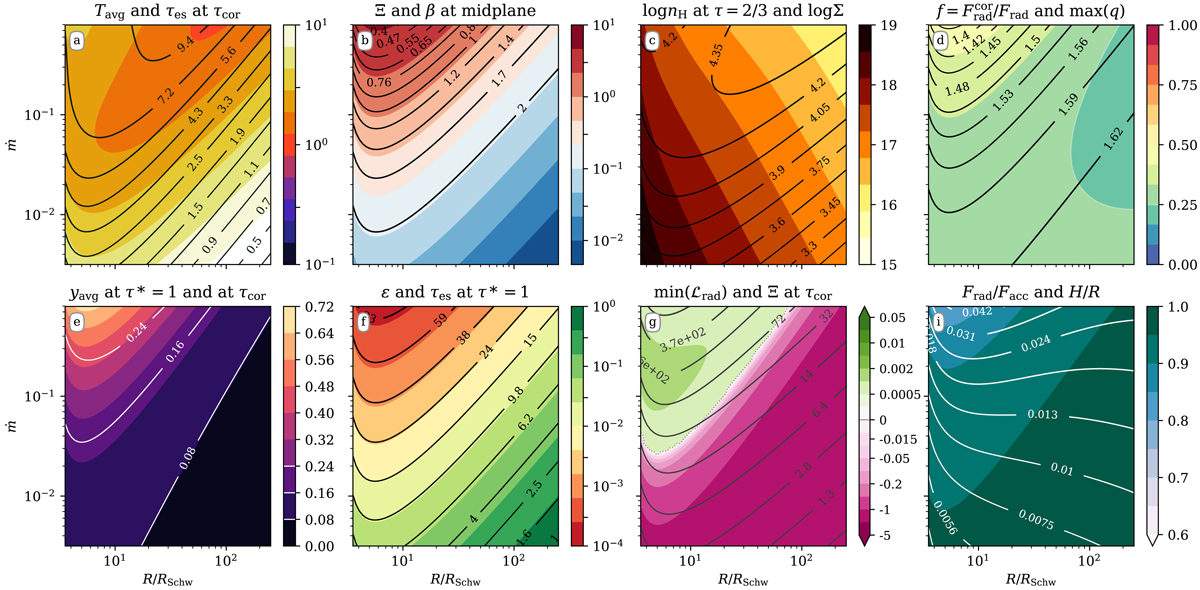
Properties of the corona on the radius (R/Rschw) – accretion rate (ṁ) parameter plane. All models are calculated for MBH = 10M⊙, αB = 0.1, and ξ = 0.05. The panels display (a) the average temperature of the corona (Eq. (44)) in keV (colors) and τcor (contours); (b) the ionization parameter Ξ (colors) and magnetic β parameter (contours), both at the disk midplane; (c) the number density at τ = 2/3 (colors) and the total column density Σ in g cm2 (contours); (d) the fraction of radiative energy produced by the corona f (Eq. (45), colors), the maximum value of the magnetic field gradient q (Eq. (35), contours); (e) the y parameter of the warm corona (Eq. (46)), computed up to the thermalization layer τ⋆ = 1 (colors) and to τcor (contours); the (f) photon destruction probability ![]() (colors) and electron scattering optical depth (τes) (contours) at the thermalization layer; (g) the minimum value of ℒrad (Eq. (37)) throughout the disk height (colors), here, green areas are stable disks, and magenta areas indicate thermal instability in the corona, the gray dotted line corresponds to ℒrad = 0, and the ionization parameter Ξ at the corona base (contours); and (h) the radiative energy flux normalized to the total accretion flux (colors), and the disk scale ratio H/R (contours).
(colors) and electron scattering optical depth (τes) (contours) at the thermalization layer; (g) the minimum value of ℒrad (Eq. (37)) throughout the disk height (colors), here, green areas are stable disks, and magenta areas indicate thermal instability in the corona, the gray dotted line corresponds to ℒrad = 0, and the ionization parameter Ξ at the corona base (contours); and (h) the radiative energy flux normalized to the total accretion flux (colors), and the disk scale ratio H/R (contours).
Current usage metrics show cumulative count of Article Views (full-text article views including HTML views, PDF and ePub downloads, according to the available data) and Abstracts Views on Vision4Press platform.
Data correspond to usage on the plateform after 2015. The current usage metrics is available 48-96 hours after online publication and is updated daily on week days.
Initial download of the metrics may take a while.