Fig. 7.
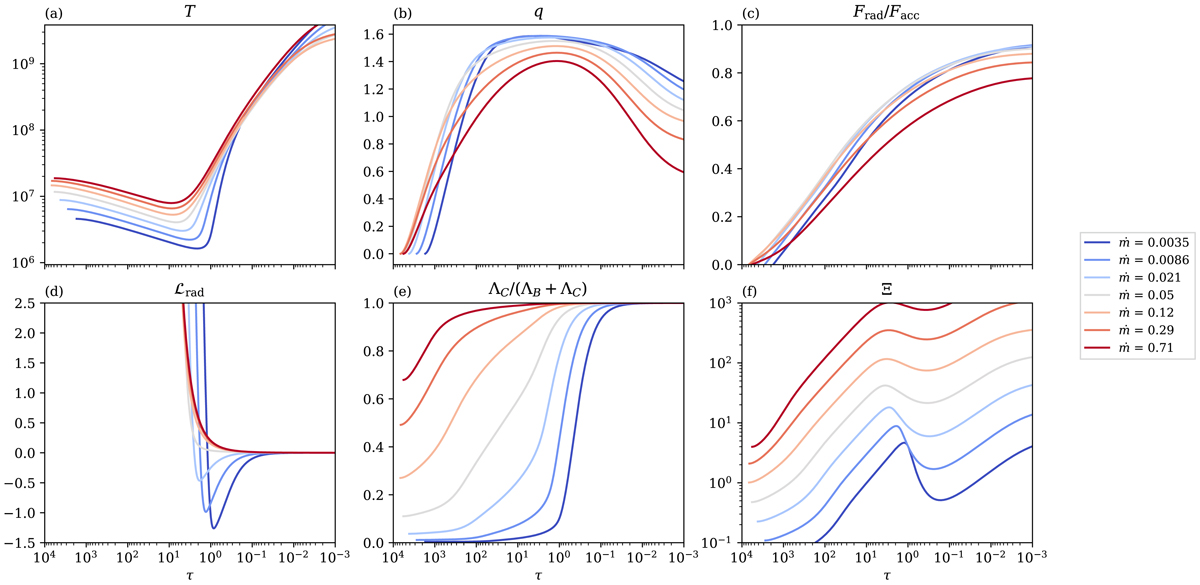
Vertical structure of the disk-corona models computed at R = 10 RSchw for different values of the accretion rate (ṁ), plotted against the total optical depth τ. The panels show (a) the gas temperature, (b) the gradient of the magnetic pressure (Eq. (34)), (c) the radiative energy flux normalized to the total accretion flux Facc, (d) the cooling function gradient (Eq. (37)), (e) the contribution of Compton cooling to the total cooling, and (f) the ionization parameter Ξ (Eq. (43)).
Current usage metrics show cumulative count of Article Views (full-text article views including HTML views, PDF and ePub downloads, according to the available data) and Abstracts Views on Vision4Press platform.
Data correspond to usage on the plateform after 2015. The current usage metrics is available 48-96 hours after online publication and is updated daily on week days.
Initial download of the metrics may take a while.