Fig. 6.
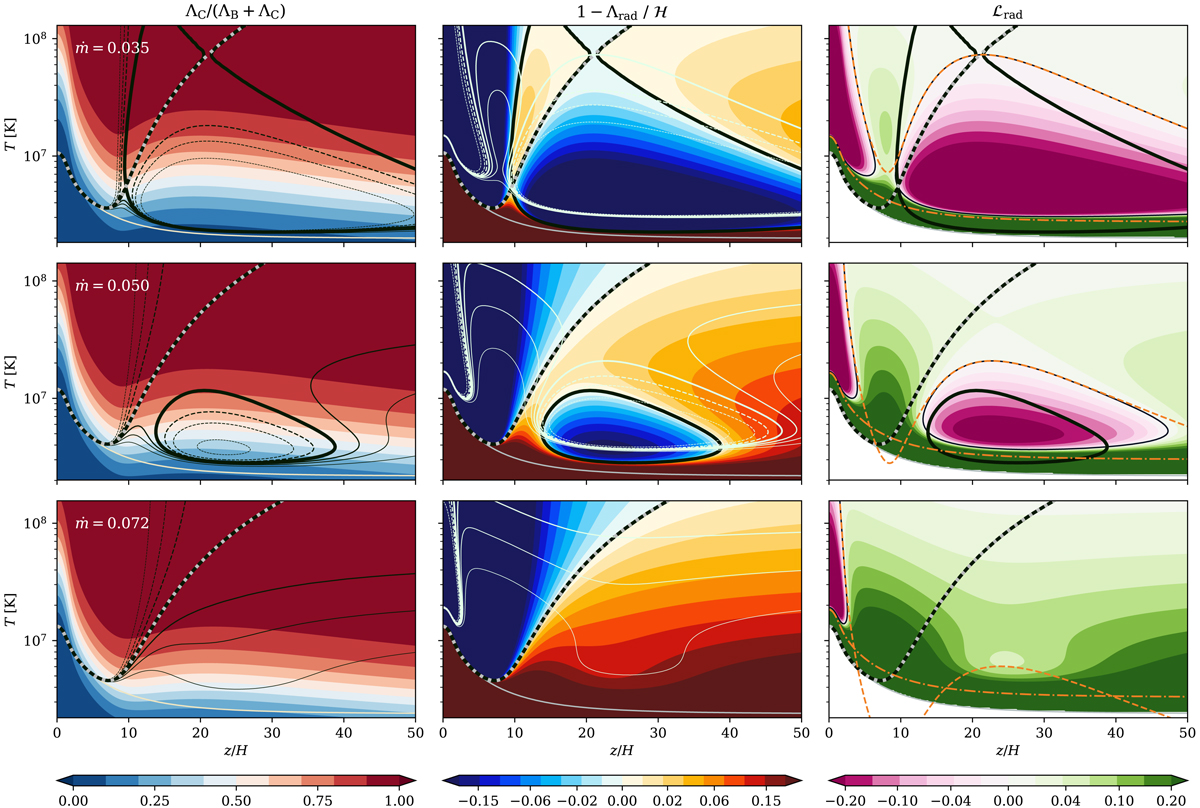
Onset of thermal instability in a low-temperature disk, ṁ = 0.035 shown in the top panels, and its stabilization with the increase of the temperature, ṁ = 0.05 and 0.072 shown in the middle and bottom panels. Other disk parameters are as given in Sect. 3.1. In each panel the vertical axis represents the possible gas temperature T assuming constant gas pressure (δPgas = 0), and the horizontal axis is the height above the disk midplane given in scale height H (Eq. (36)). The possible solutions that satisfy the radiative energy balance are shown with thick black contours, while the solution obtained from our numerical computations is additionally marked with light gray dots. A thinner gray line is used to show the radiation temperature, Trad. Color maps in the first panels column show the contribution from Compton scattering to the total cooling. In the second column, the overall heating-cooling balance is shown: the yellow-orange areas are where the heating dominates cooling, and blue areas show where the cooling rate exceeds the heating. The third column presents the stability diagnostic, i.e., the cooling function gradient ℒrad (Eq. (37)), with green areas marking the stable regions and violet areas the unstable regions. Two limit solutions according to Eqs. (40) and (41) are plotted with orange lines (dash-dotted and dashed, respectively) and show excellent agreement with the numerical solution. Additionally, the content of neighboring plots (from right panels to the middle, and from middle to the left) are superimposed as thin contours for the sake of clarity.
Current usage metrics show cumulative count of Article Views (full-text article views including HTML views, PDF and ePub downloads, according to the available data) and Abstracts Views on Vision4Press platform.
Data correspond to usage on the plateform after 2015. The current usage metrics is available 48-96 hours after online publication and is updated daily on week days.
Initial download of the metrics may take a while.