Fig. 5.
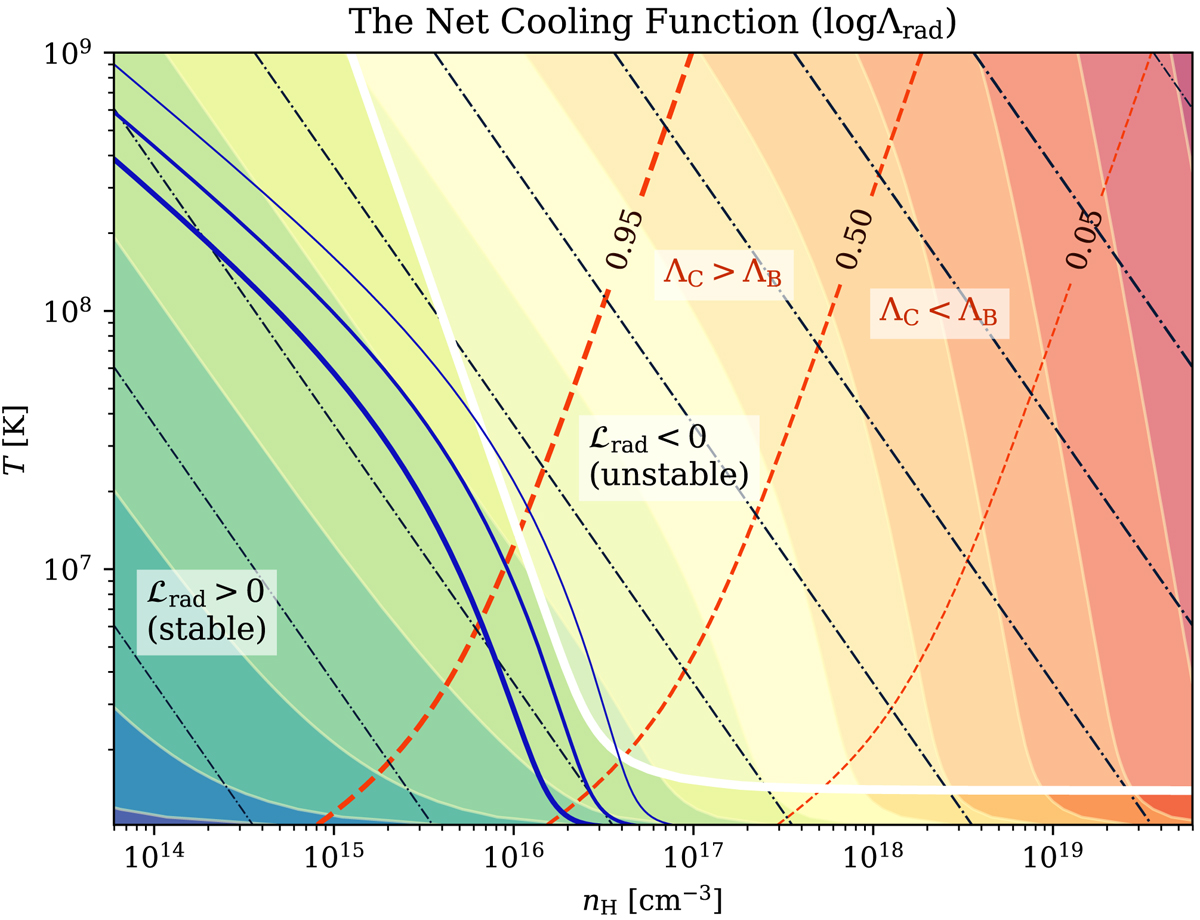
Logarithm of the net cooling rate Λrad (Eq. (17)), plotted in the nH – T parameter plane ranging from blue (low rate) to red (high rate). The points of constant pressure are connected with black dash-dotted lines. The red dotted contours show the contribution of the Compton cooling to the total cooling. The solid white line shows where the cooling function is constant in isobaric perturbation, and separates the area of unstable solutions where the gradient of the cooling function ℒrad < 0. Dark blue lines of increasing width represent the vertical structure for three accretion rates 0.035, 0.050, and 0.072.
Current usage metrics show cumulative count of Article Views (full-text article views including HTML views, PDF and ePub downloads, according to the available data) and Abstracts Views on Vision4Press platform.
Data correspond to usage on the plateform after 2015. The current usage metrics is available 48-96 hours after online publication and is updated daily on week days.
Initial download of the metrics may take a while.