Fig. 12.
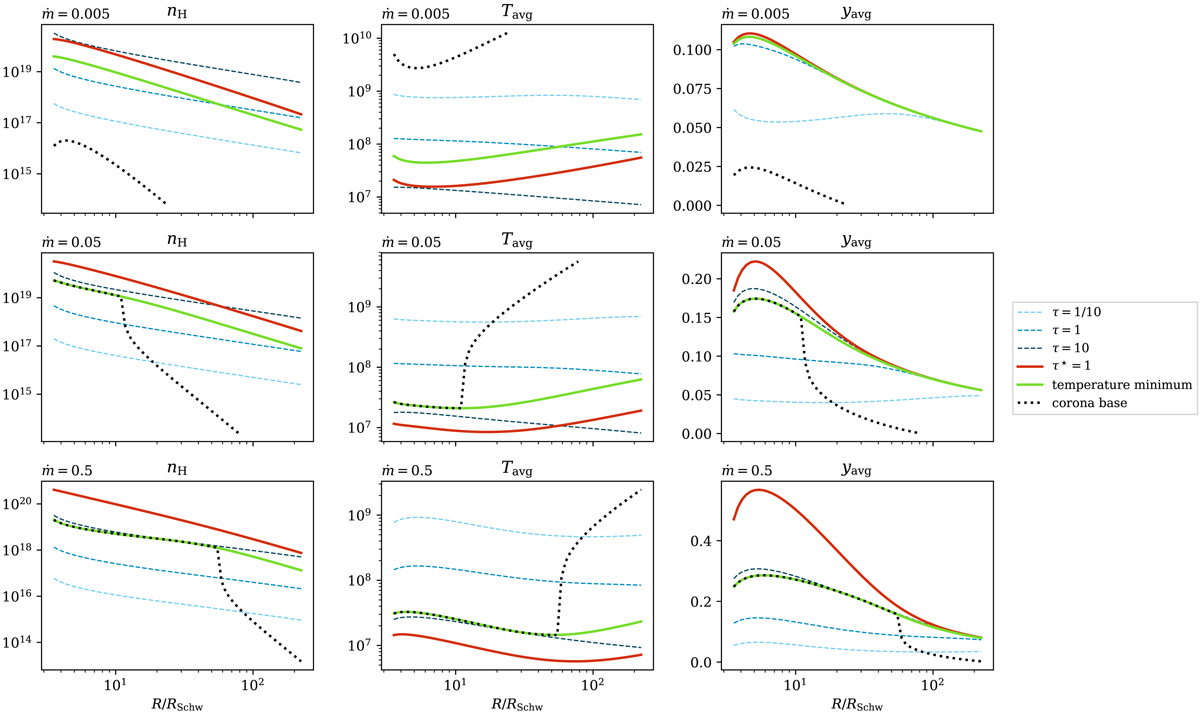
Radial profiles of selected quantities: gas density ρ [cm−3], average temperature Tavg [K], and average Compton yavg (Eq. (46)), measured at different depths in the disk atmosphere. Values at τ = 0.1, τ = 1, and τ = 10 are shown by dashed blue lines, at temperature minimum (τcor) by the green line, at thermalization depth by the red line, and at the corona base (determined by temperature minimum or thermal instability in case it is developed) with the black dotted line.
Current usage metrics show cumulative count of Article Views (full-text article views including HTML views, PDF and ePub downloads, according to the available data) and Abstracts Views on Vision4Press platform.
Data correspond to usage on the plateform after 2015. The current usage metrics is available 48-96 hours after online publication and is updated daily on week days.
Initial download of the metrics may take a while.