Fig. 4.
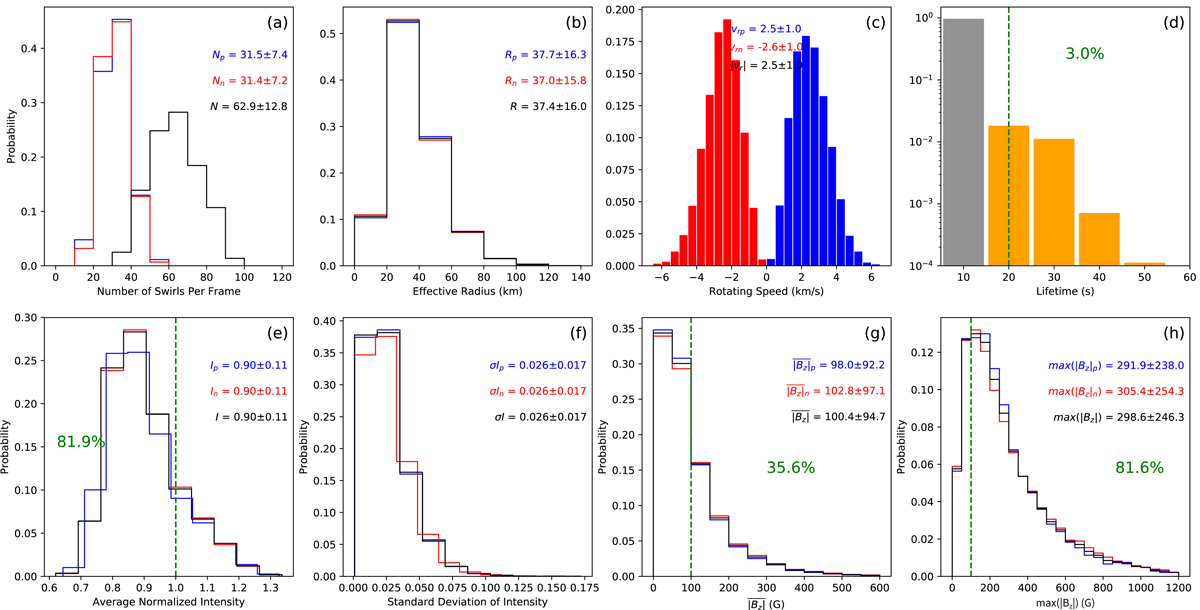
Statistics of the photospheric velocity swirls detected by ASDA from the numerical simulations. In panels a–c and e–h, swirls with negative (positive) rotations are shown in red (blue), and all swirls are shown in black. N denotes the number of swirls in each frame of the simulation, R the average effective radius, vr the average rotating speed, I the average normalized photospheric intensity within the area of each swirl, σI the standard deviation of the normalized photospheric intensity of each swirl, ![]() the average absolute vertical magnetic field strength of each swirl, and max(|Bz|) the maximum absolute vertical magnetic field strength of each swirl. The green vertical lines in (panels d, e, and g–h) depict a lifetime of 20 s, an average normalized photospheric intensity of 1, and a vertical magnetic field strength of 100 G, respectively.
the average absolute vertical magnetic field strength of each swirl, and max(|Bz|) the maximum absolute vertical magnetic field strength of each swirl. The green vertical lines in (panels d, e, and g–h) depict a lifetime of 20 s, an average normalized photospheric intensity of 1, and a vertical magnetic field strength of 100 G, respectively.
Current usage metrics show cumulative count of Article Views (full-text article views including HTML views, PDF and ePub downloads, according to the available data) and Abstracts Views on Vision4Press platform.
Data correspond to usage on the plateform after 2015. The current usage metrics is available 48-96 hours after online publication and is updated daily on week days.
Initial download of the metrics may take a while.