Fig. 6
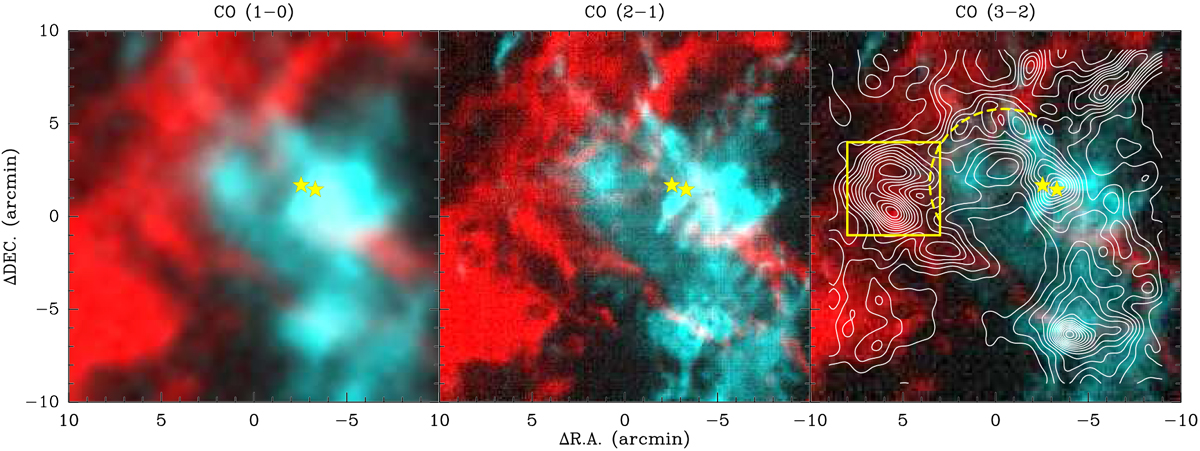
Complementary distribution between L1188a and L1188b observed in 12CO (1–0) (left), 12CO (2–1) (middle), and 12CO (3–2) (right). In all panels, turquoise and red represent the intensity maps integrated from −14 to −11 km s−1 and from −8 to −5 km s−1, respectively.In the right panel, the overlaid contours are the same as those in Fig. 3h. The curved region that shows enhanced 13CO emission is indicated by the yellow box, while the centric concave shape of L1188b is indicated by the yellow dashed arc. In each panel, the two pentagrams represent the two 22 GHz water maser positions discussed in Sect. 3.3.
Current usage metrics show cumulative count of Article Views (full-text article views including HTML views, PDF and ePub downloads, according to the available data) and Abstracts Views on Vision4Press platform.
Data correspond to usage on the plateform after 2015. The current usage metrics is available 48-96 hours after online publication and is updated daily on week days.
Initial download of the metrics may take a while.