Fig. 3
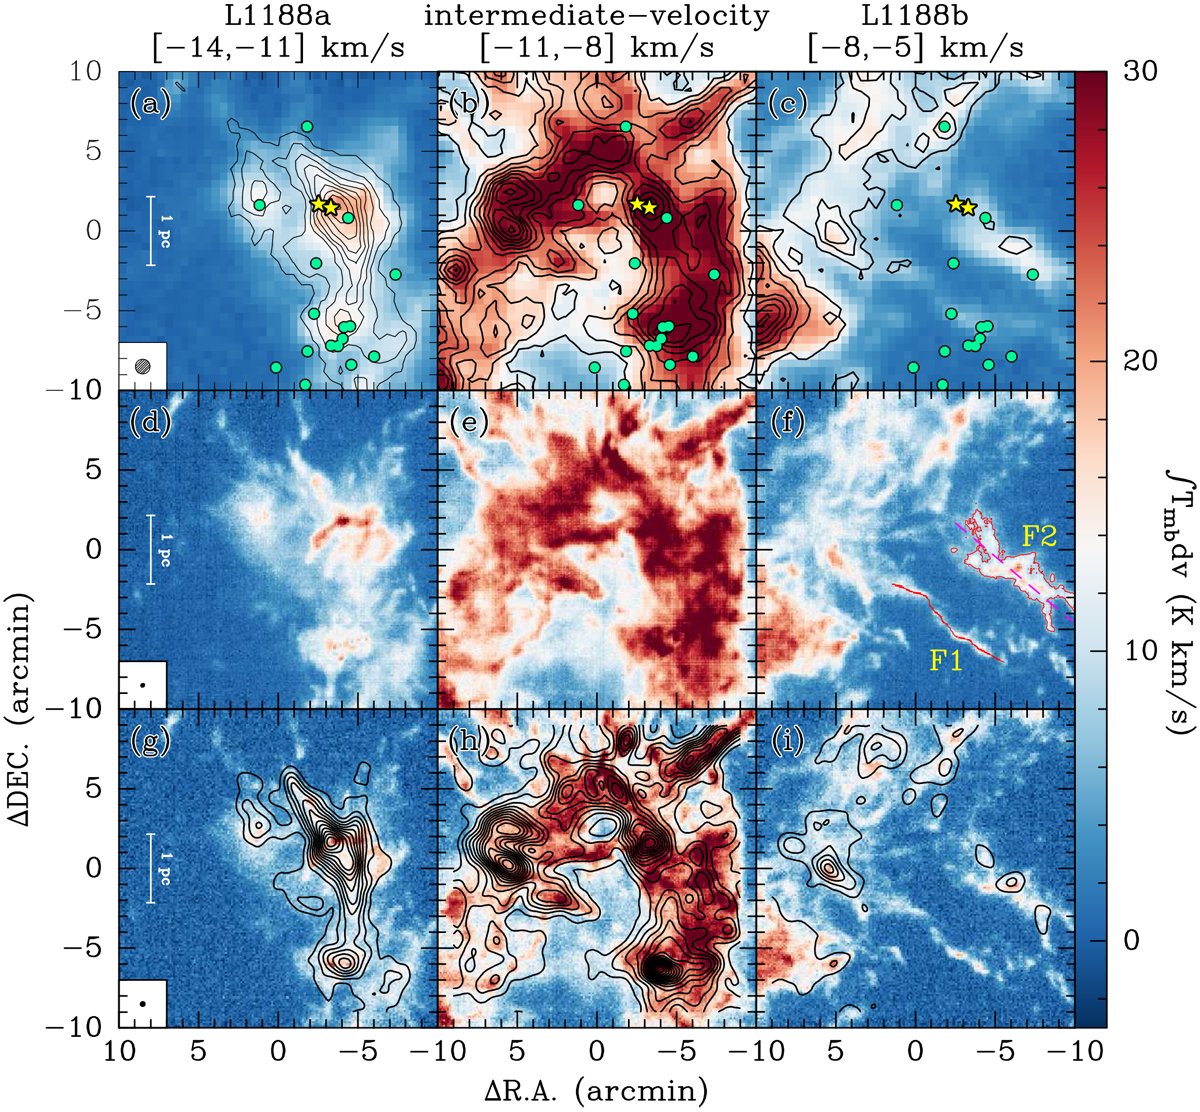
12CO (1–0) intensity map (color scale) integrated (a) from −14 to −11 km s−1, (b) from −11 to −8 km s−1, (c) from −8 to −5 km s−1. In panels a–c, the contours represent the integrated intensity maps of 13CO (1–0), and their integrated velocity ranges are the same as those of the corresponding CO maps. The contours start from 0.9 K km s−1 (5σ), and increase by 0.9 K km s−1. Panels d–f and g–i: similar to panels a–c but for 12CO (2–1) and 12CO (3–2), respectively. In panels g–i, the contours represent the smoothed (55′′) integrated intensity maps of 13CO (3–2), and start from 0.3 K km s−1 (5σ), and increase by 0.3 K km s−1. Panels g–i have been scaled by a factor of two to match the color bar. In panels a–c, the green filled circles represent the YSO candidates from Szegedi-Elek et al. (2019) and the two yellow pentagrams represent the two 22 GHz water maser positions discussed in Sect. 3.3. The filamentary structures F1 and F2 are outlined in panel f. The beam size for CO (1–0), CO (2–1), and CO (3–2) are shown in the lower left corner of panels a, d, and g, respectively. In all panels, the (0, 0) offset corresponds to αJ2000 = 22h18m00s.44, δJ2000 = 61°49′03.′′7.
Current usage metrics show cumulative count of Article Views (full-text article views including HTML views, PDF and ePub downloads, according to the available data) and Abstracts Views on Vision4Press platform.
Data correspond to usage on the plateform after 2015. The current usage metrics is available 48-96 hours after online publication and is updated daily on week days.
Initial download of the metrics may take a while.