Fig. 13
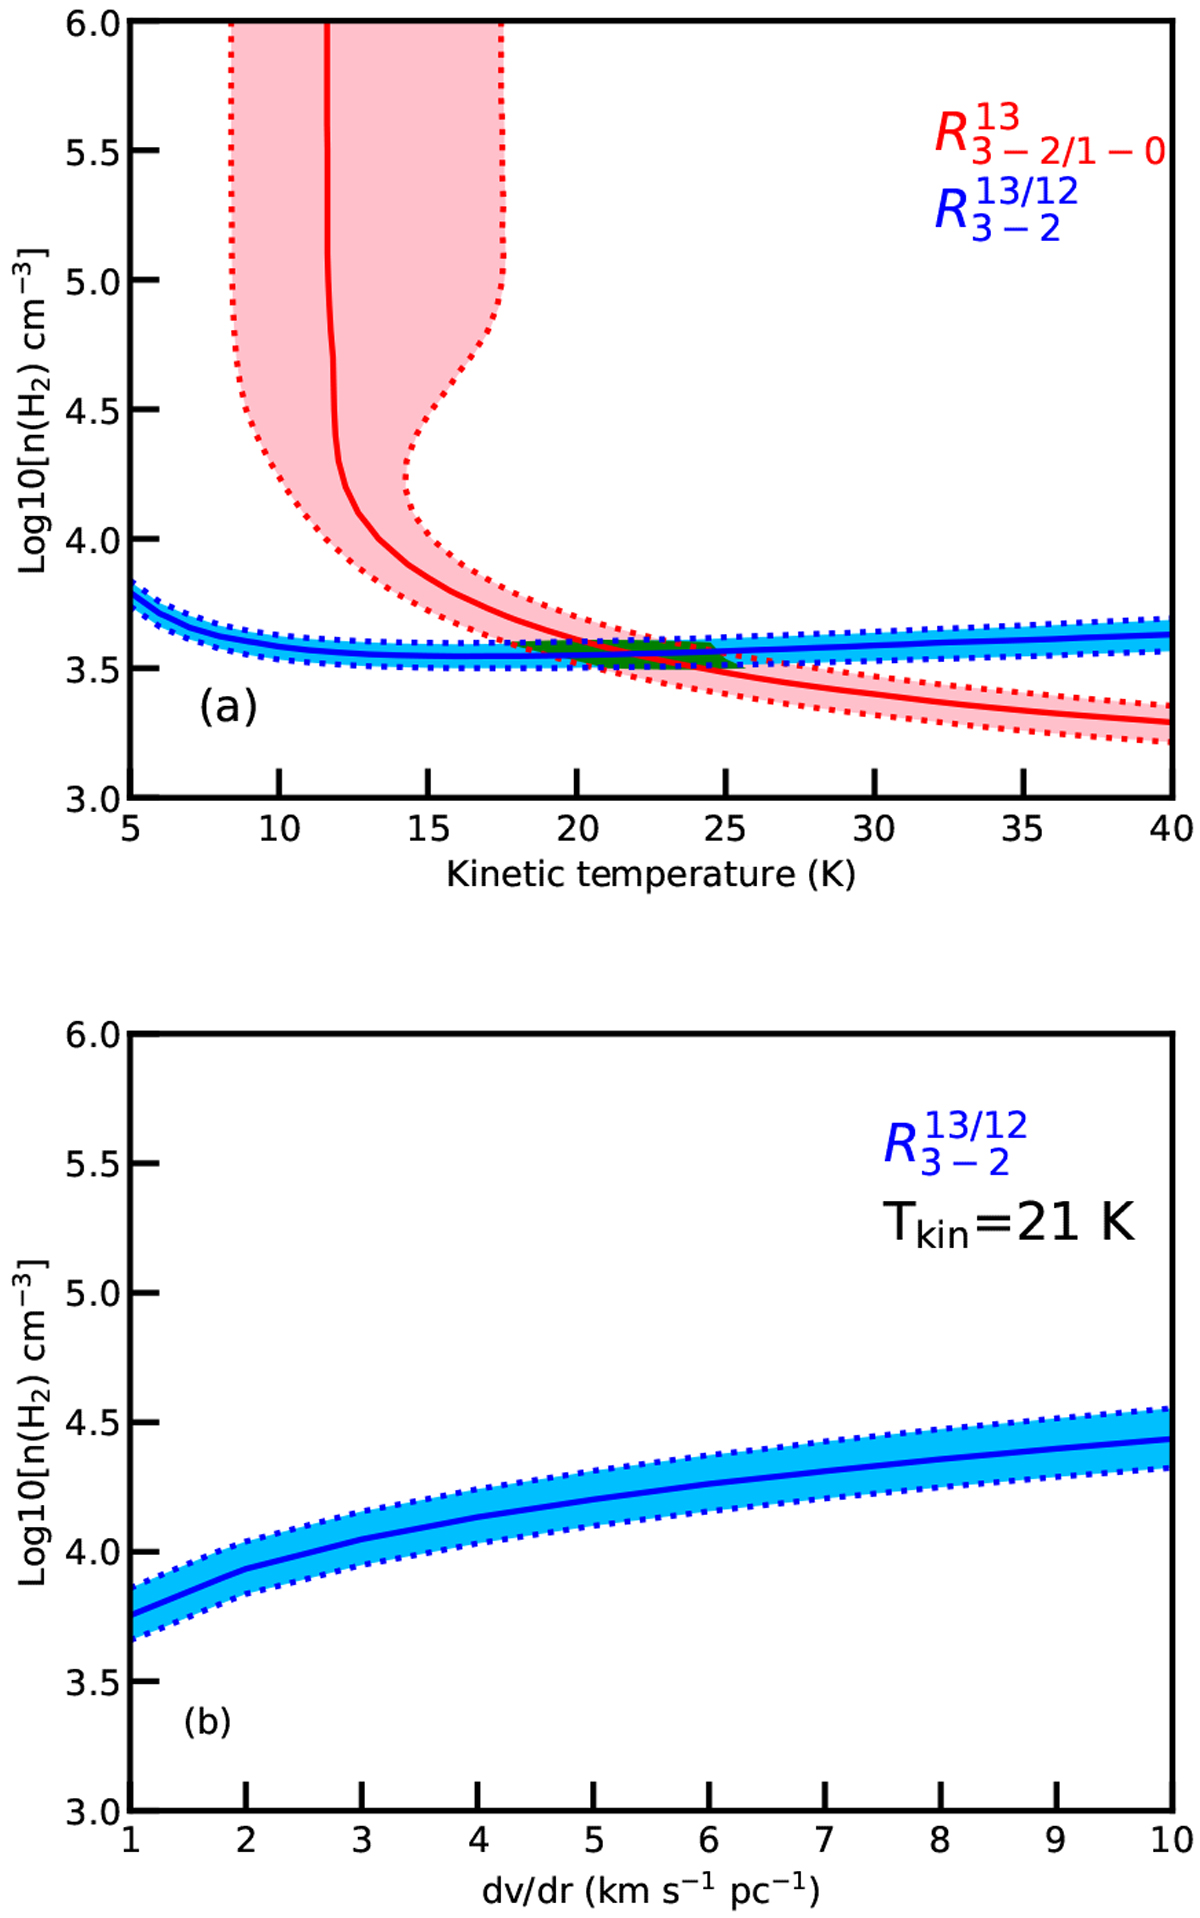
RADEX calculations on modeling the line ratios toward the peak position in region C2 (αJ2000 = 22h17m27s.4, δJ2000 = 61°42′42′′) indicated by the cross in Figs. 12c and d. (a) The modeled line ratios,
![]() (red) and
(red) and ![]() (blue), as a function of kinetic temperature and H2 number density. The solid lines and the dotted lines represent the observed line ratios and their 1σ uncertainties for
(blue), as a function of kinetic temperature and H2 number density. The solid lines and the dotted lines represent the observed line ratios and their 1σ uncertainties for ![]() and
and ![]() . The shadowed region in the intersection represents χ2 <2.3, corresponding to the 1σ
range. (b) The modeled
. The shadowed region in the intersection represents χ2 <2.3, corresponding to the 1σ
range. (b) The modeled ![]() as a functionof H2 number density at a given kinetic temperature of 21 K.
as a functionof H2 number density at a given kinetic temperature of 21 K.
Current usage metrics show cumulative count of Article Views (full-text article views including HTML views, PDF and ePub downloads, according to the available data) and Abstracts Views on Vision4Press platform.
Data correspond to usage on the plateform after 2015. The current usage metrics is available 48-96 hours after online publication and is updated daily on week days.
Initial download of the metrics may take a while.