Fig. 12
Line ratio ![]() (a),
(a), ![]() (b),
(b), ![]() (c), and
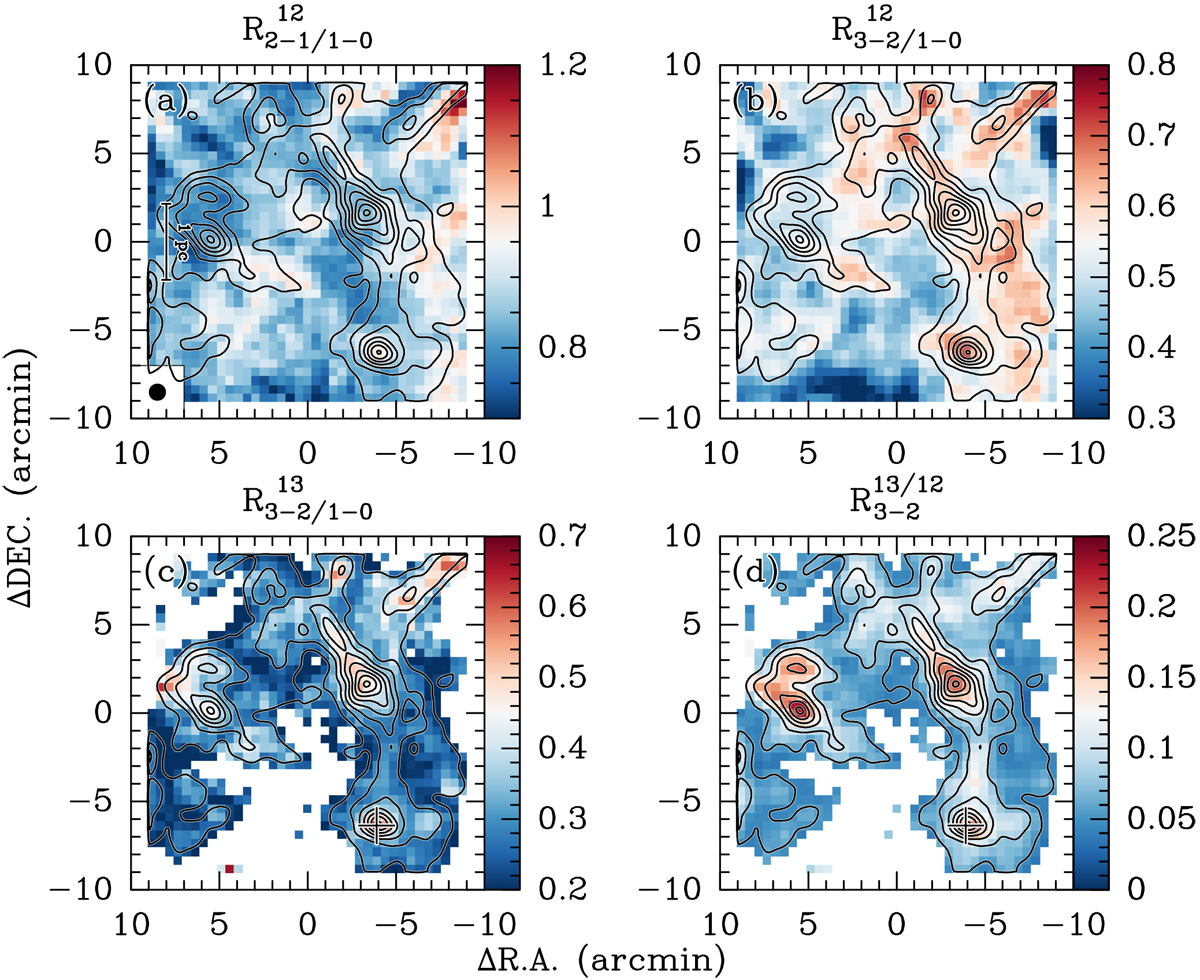
(c), and ![]() (d) distribution of the observed region. The overlaid contours are 13CO (3–2) integrated intensities, which start from 0.9 K km s−1 (6σ) and increase by 0.9 K km s−1. The beam sizes are shown in the lower left corner of panel a. In all panels, the (0, 0) offset corresponds to αJ2000 = 22h18m00s.44, δJ2000 = 61°49′03.′′7. In panels c and d, the cross represents the peak position of region C2 that is analyzed in Fig. 13.
(d) distribution of the observed region. The overlaid contours are 13CO (3–2) integrated intensities, which start from 0.9 K km s−1 (6σ) and increase by 0.9 K km s−1. The beam sizes are shown in the lower left corner of panel a. In all panels, the (0, 0) offset corresponds to αJ2000 = 22h18m00s.44, δJ2000 = 61°49′03.′′7. In panels c and d, the cross represents the peak position of region C2 that is analyzed in Fig. 13.
Current usage metrics show cumulative count of Article Views (full-text article views including HTML views, PDF and ePub downloads, according to the available data) and Abstracts Views on Vision4Press platform.
Data correspond to usage on the plateform after 2015. The current usage metrics is available 48-96 hours after online publication and is updated daily on week days.
Initial download of the metrics may take a while.