Fig. 11
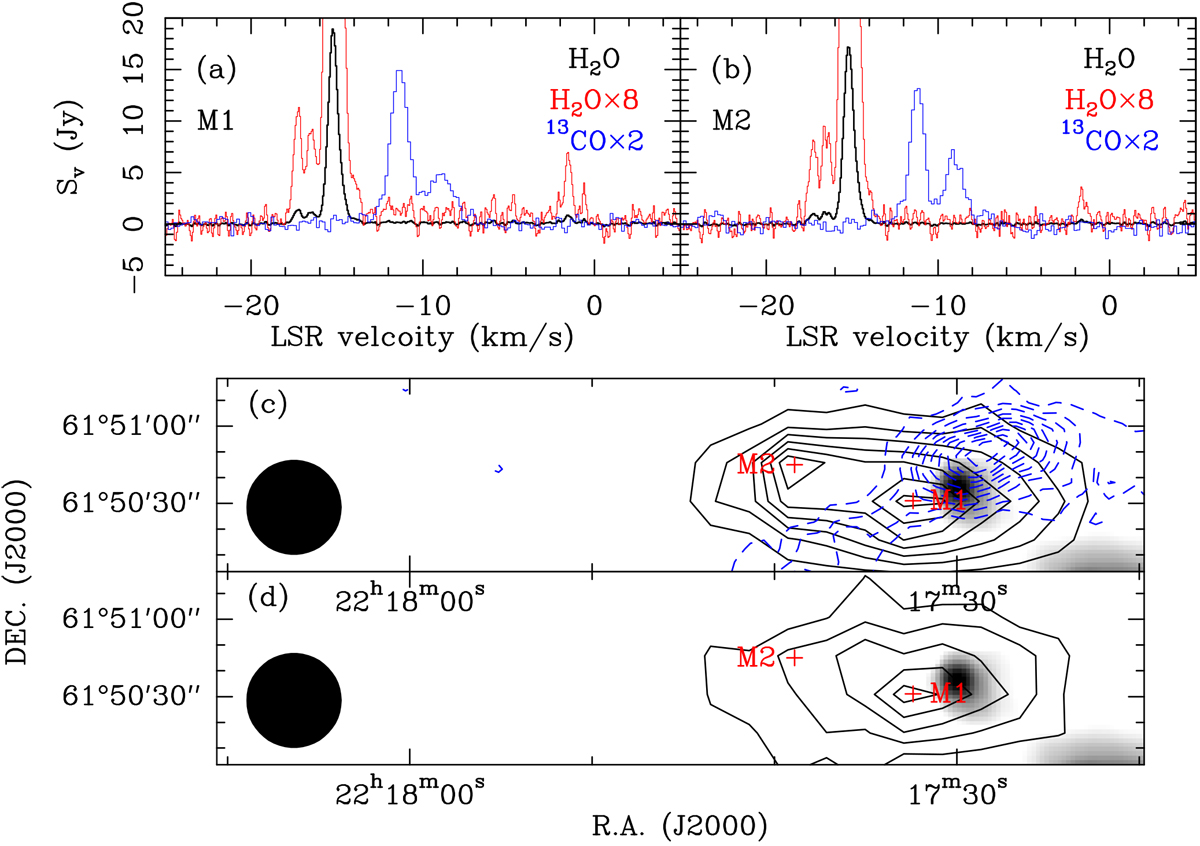
(a) Observed 22 GHz H2O maser (black) and 13CO (1–0) (blue)spectra toward the position M1. (b) Similar to a, but for the position M2. In panels a and b, the red lines represent the 22 GHz H2O maser lines,which are scaled by a factor of eight in order to better visualize weak velocity components. (c) 22 GHz H2 O maser integrated intensity contours (black) overlaid on the WISE 22 μm image. The integrated velocity range is from −18 to −14 km s−1. The black contours start at 2 Jy km s−1 and increase by 2 Jy km s−1. The blue dashed contours represent the 12CO (3–2) integrated intensities which start at 2.4 K km s−1 (3σ) and increase by 2.4 K km s−1. (d) 22 GHz H2O maser integrated intensity contours overlaid on the WISE 22 μm image. The integrated velocity range is from −2 to −0 km s−1. The contours start from 0.1 Jy km s−1 and increase by 0.1 Jy km s−1. In panels c and d, the beam size is shown in the lower left corner of each panel.
Current usage metrics show cumulative count of Article Views (full-text article views including HTML views, PDF and ePub downloads, according to the available data) and Abstracts Views on Vision4Press platform.
Data correspond to usage on the plateform after 2015. The current usage metrics is available 48-96 hours after online publication and is updated daily on week days.
Initial download of the metrics may take a while.