Fig. 10
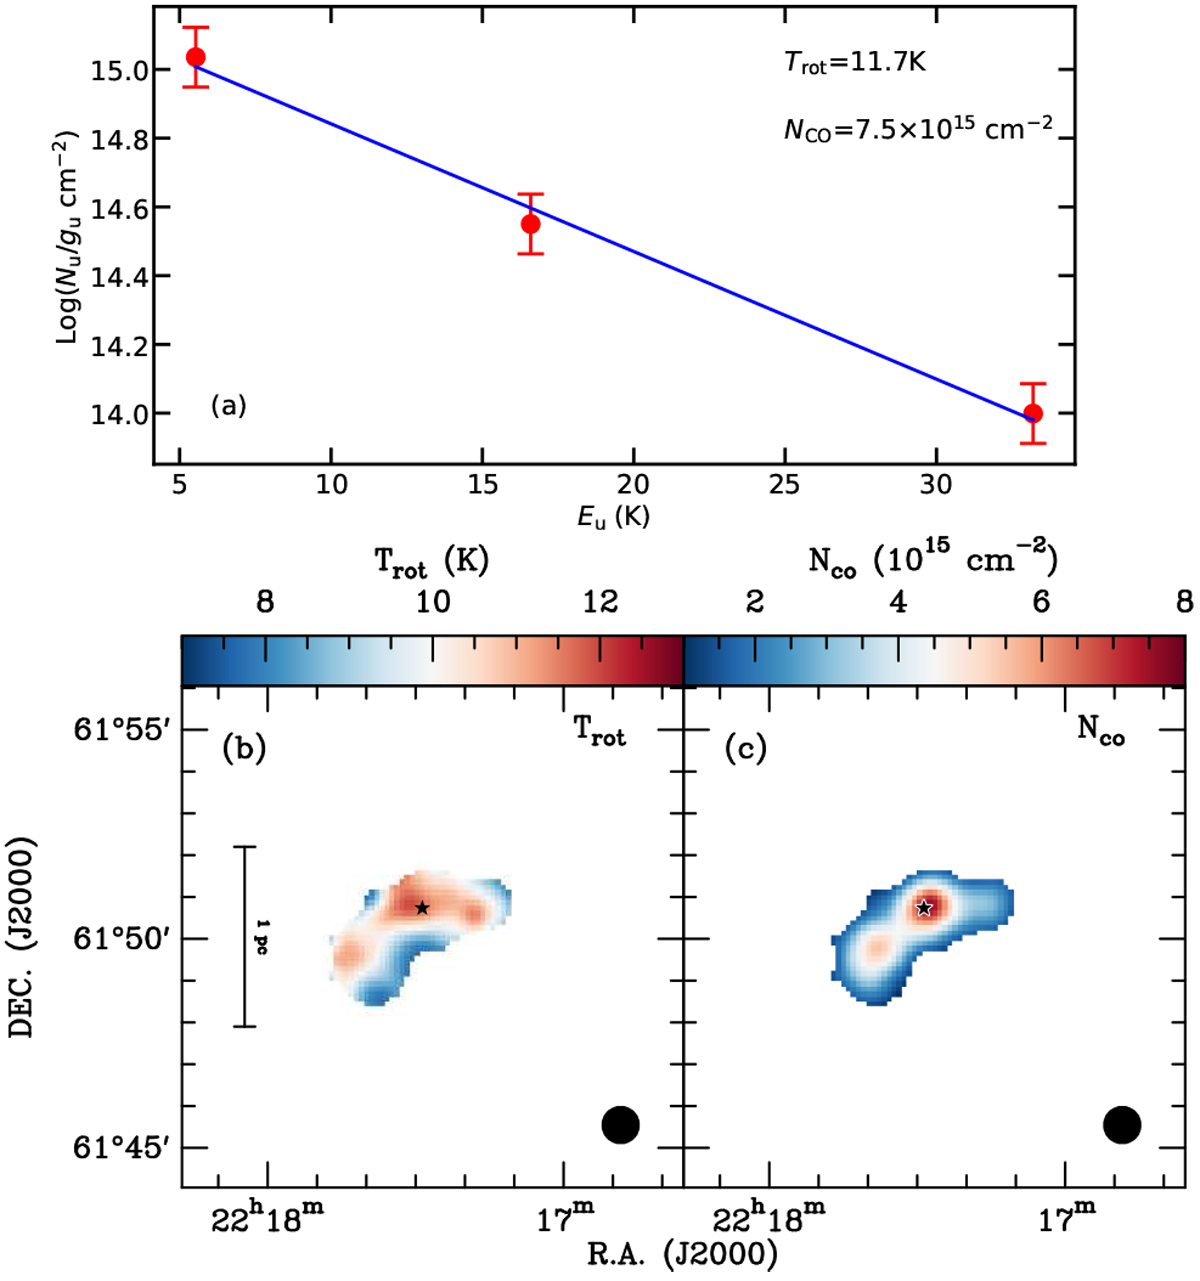
(a) Rotational diagram of the peak position in the arc (αJ2000 = 22h17m28s.6, δJ2000 = 61°50′44.′′8) indicated by the pentagram in b and c. (b) Distribution of rotational temperatures in the arc structure. (c) Distribution of derived 12CO column densities in the arc structure. The beam size is shown in the lower right corner of b and c.
Current usage metrics show cumulative count of Article Views (full-text article views including HTML views, PDF and ePub downloads, according to the available data) and Abstracts Views on Vision4Press platform.
Data correspond to usage on the plateform after 2015. The current usage metrics is available 48-96 hours after online publication and is updated daily on week days.
Initial download of the metrics may take a while.