Fig. 8.
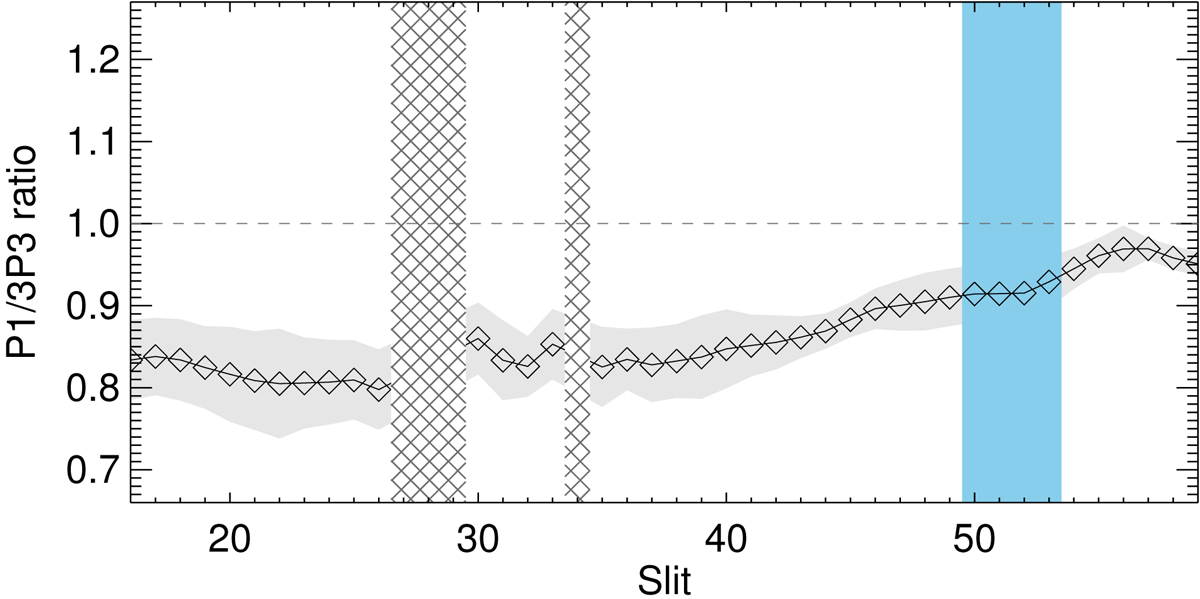
Ratio of fitted period of the fundamental to 3 times the fitted period for the third harmonic, for each slit. Unity is marked with a dashed grey line. The blue region denotes the approximate range in which the n = 3 node exists. The grey region shows an estimate of the credible intervals for this ratio. These are derived using the credible intervals on the periods measured separately for the two harmonics, and propagated through the formula P1/3P3 in the usual manner for errors.
Current usage metrics show cumulative count of Article Views (full-text article views including HTML views, PDF and ePub downloads, according to the available data) and Abstracts Views on Vision4Press platform.
Data correspond to usage on the plateform after 2015. The current usage metrics is available 48-96 hours after online publication and is updated daily on week days.
Initial download of the metrics may take a while.