Fig. 5.
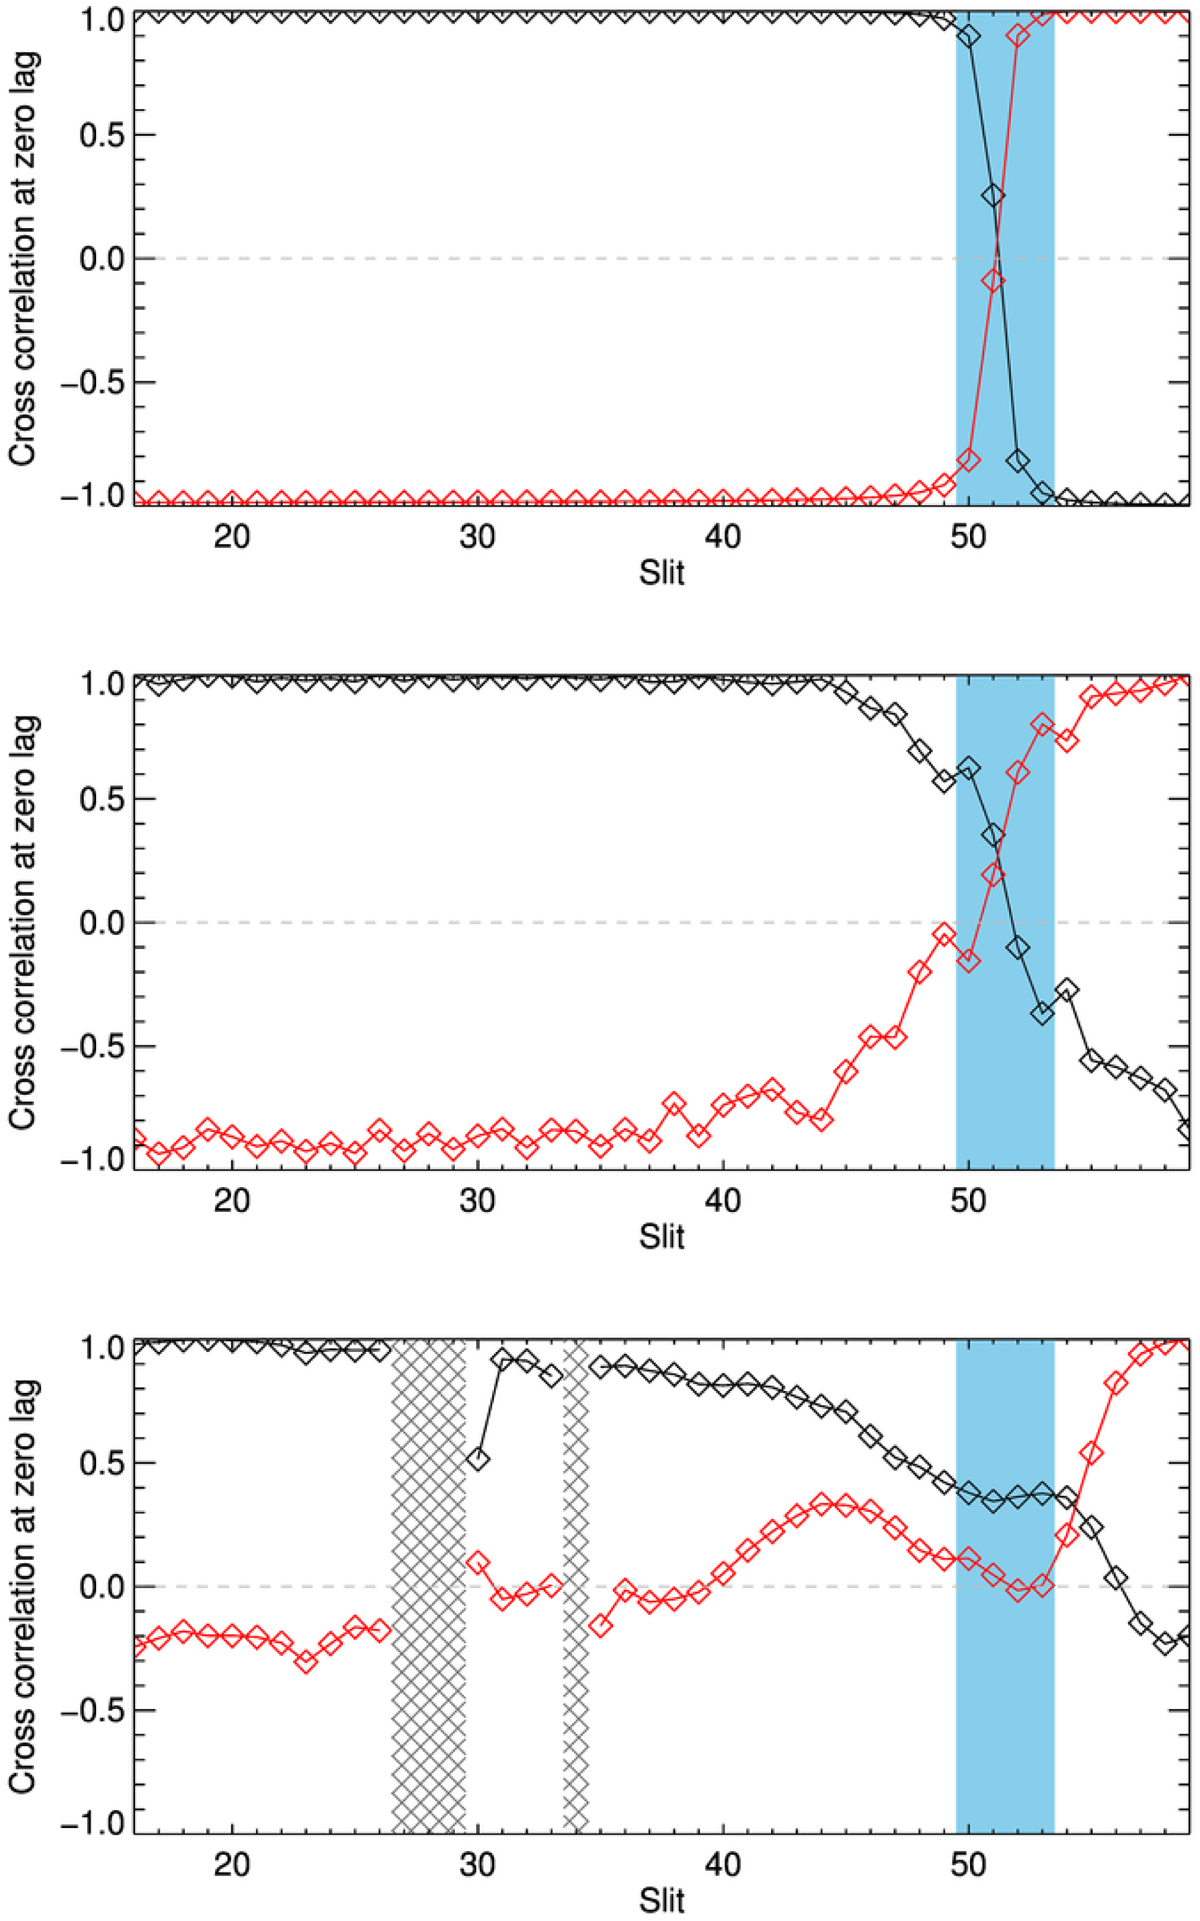
Correlation values calculated when a slit’s time series is cross correlated with a reference slit. Cross correlation values with the reference slit near the apex (slit 59) are shown in red, and on the same plot, the cross correlation values with the reference slit near the leg (slit 19) are shown in black. The region marked by blue highlights where the amplitude of the third harmonic is low, and data is not trustworthy. Top: expected correlations, calculated using synthetically generated time series for a perfect third harmonic signal, incorporating the side on perspective and only showing one leg (as is the case for the real data). Middle: synthetically generated time series consisting of a fundamental mode, a third harmonic and (coloured) noise. This synthetic signal also underwent the same bandpass filter as was used on the data. Bottom: correlation plot calculated from data. The existence of the node of the third harmonic is clearly seen.
Current usage metrics show cumulative count of Article Views (full-text article views including HTML views, PDF and ePub downloads, according to the available data) and Abstracts Views on Vision4Press platform.
Data correspond to usage on the plateform after 2015. The current usage metrics is available 48-96 hours after online publication and is updated daily on week days.
Initial download of the metrics may take a while.