Fig. 3.
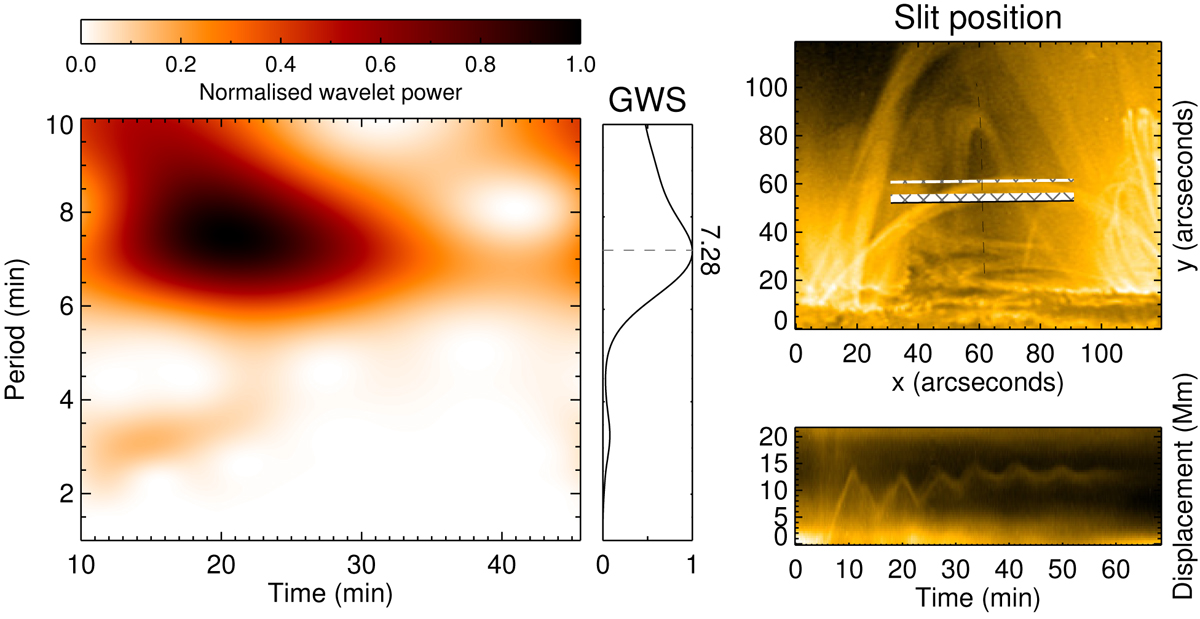
Left: morlet wavelet plot of the time series data corresponding to slit 26. Middle: global wavelet spectrum, normalised to its maximum value. The period of maximal global wavelet power for this slit’s time series is found to be 7.28 min. Right top: SDO/AIA image, rotated for reader’s convenience, on which the loop midplane (dashed line) and slit position (solid line) is overlaid. Right bottom: time-distance map for this slit (zoomed), from which the time series is extracted.
Current usage metrics show cumulative count of Article Views (full-text article views including HTML views, PDF and ePub downloads, according to the available data) and Abstracts Views on Vision4Press platform.
Data correspond to usage on the plateform after 2015. The current usage metrics is available 48-96 hours after online publication and is updated daily on week days.
Initial download of the metrics may take a while.