Fig. 1.
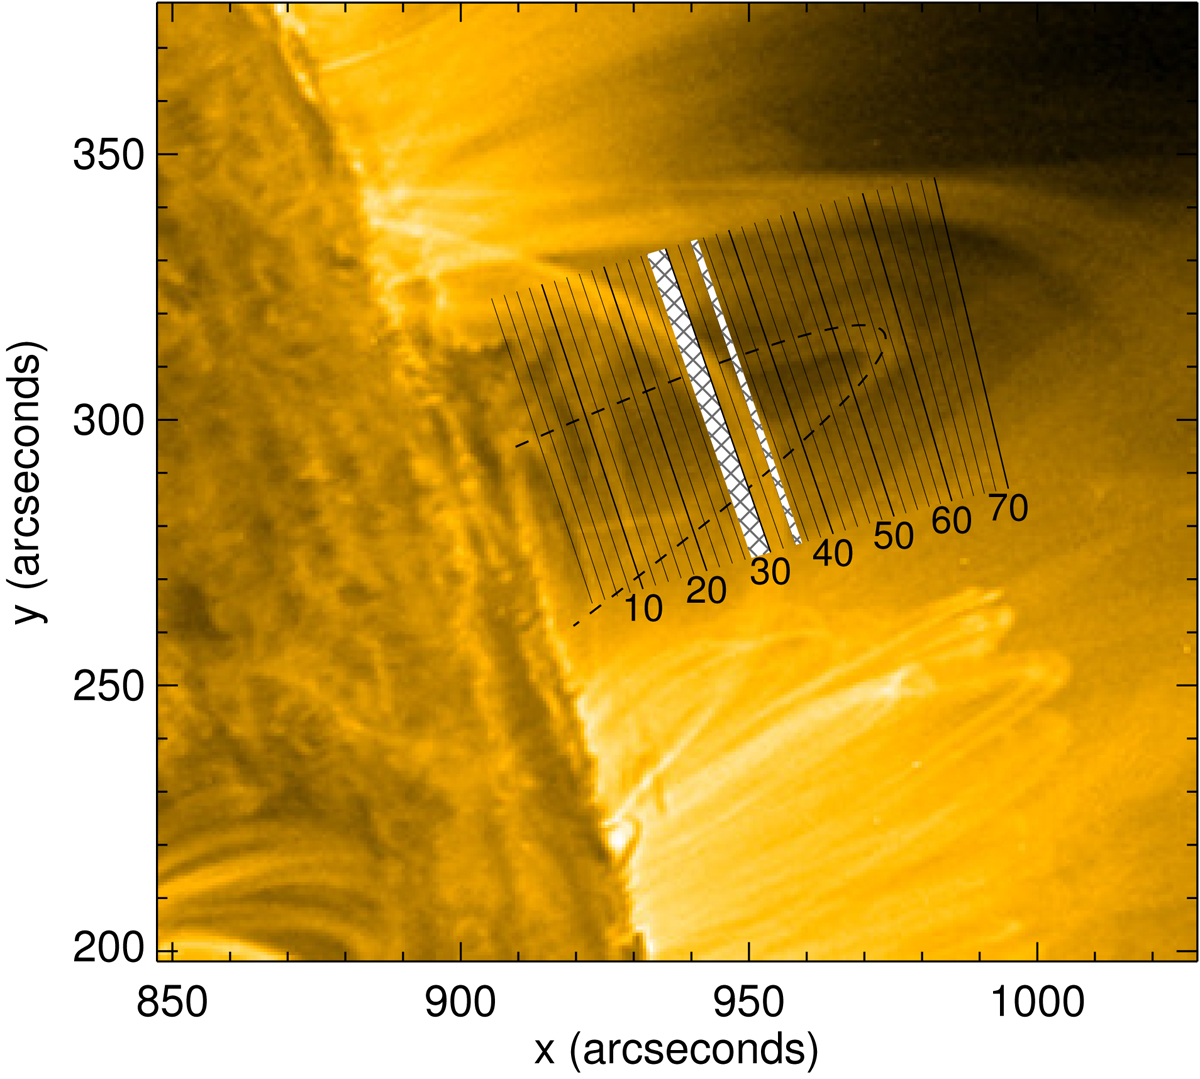
SDO/AIA 171 Å image of the loop, 2012 May 26 20:50 UT. Every other slit location used to extract time-distance data from is indicated. The slit nearest the limb is indexed 1, the slit nearest the apex is indexed 60, as indicated by the labelled slits with thicker lines. The white hashed areas denote noisy slits where data was not good enough to get reliable time series.
Current usage metrics show cumulative count of Article Views (full-text article views including HTML views, PDF and ePub downloads, according to the available data) and Abstracts Views on Vision4Press platform.
Data correspond to usage on the plateform after 2015. The current usage metrics is available 48-96 hours after online publication and is updated daily on week days.
Initial download of the metrics may take a while.