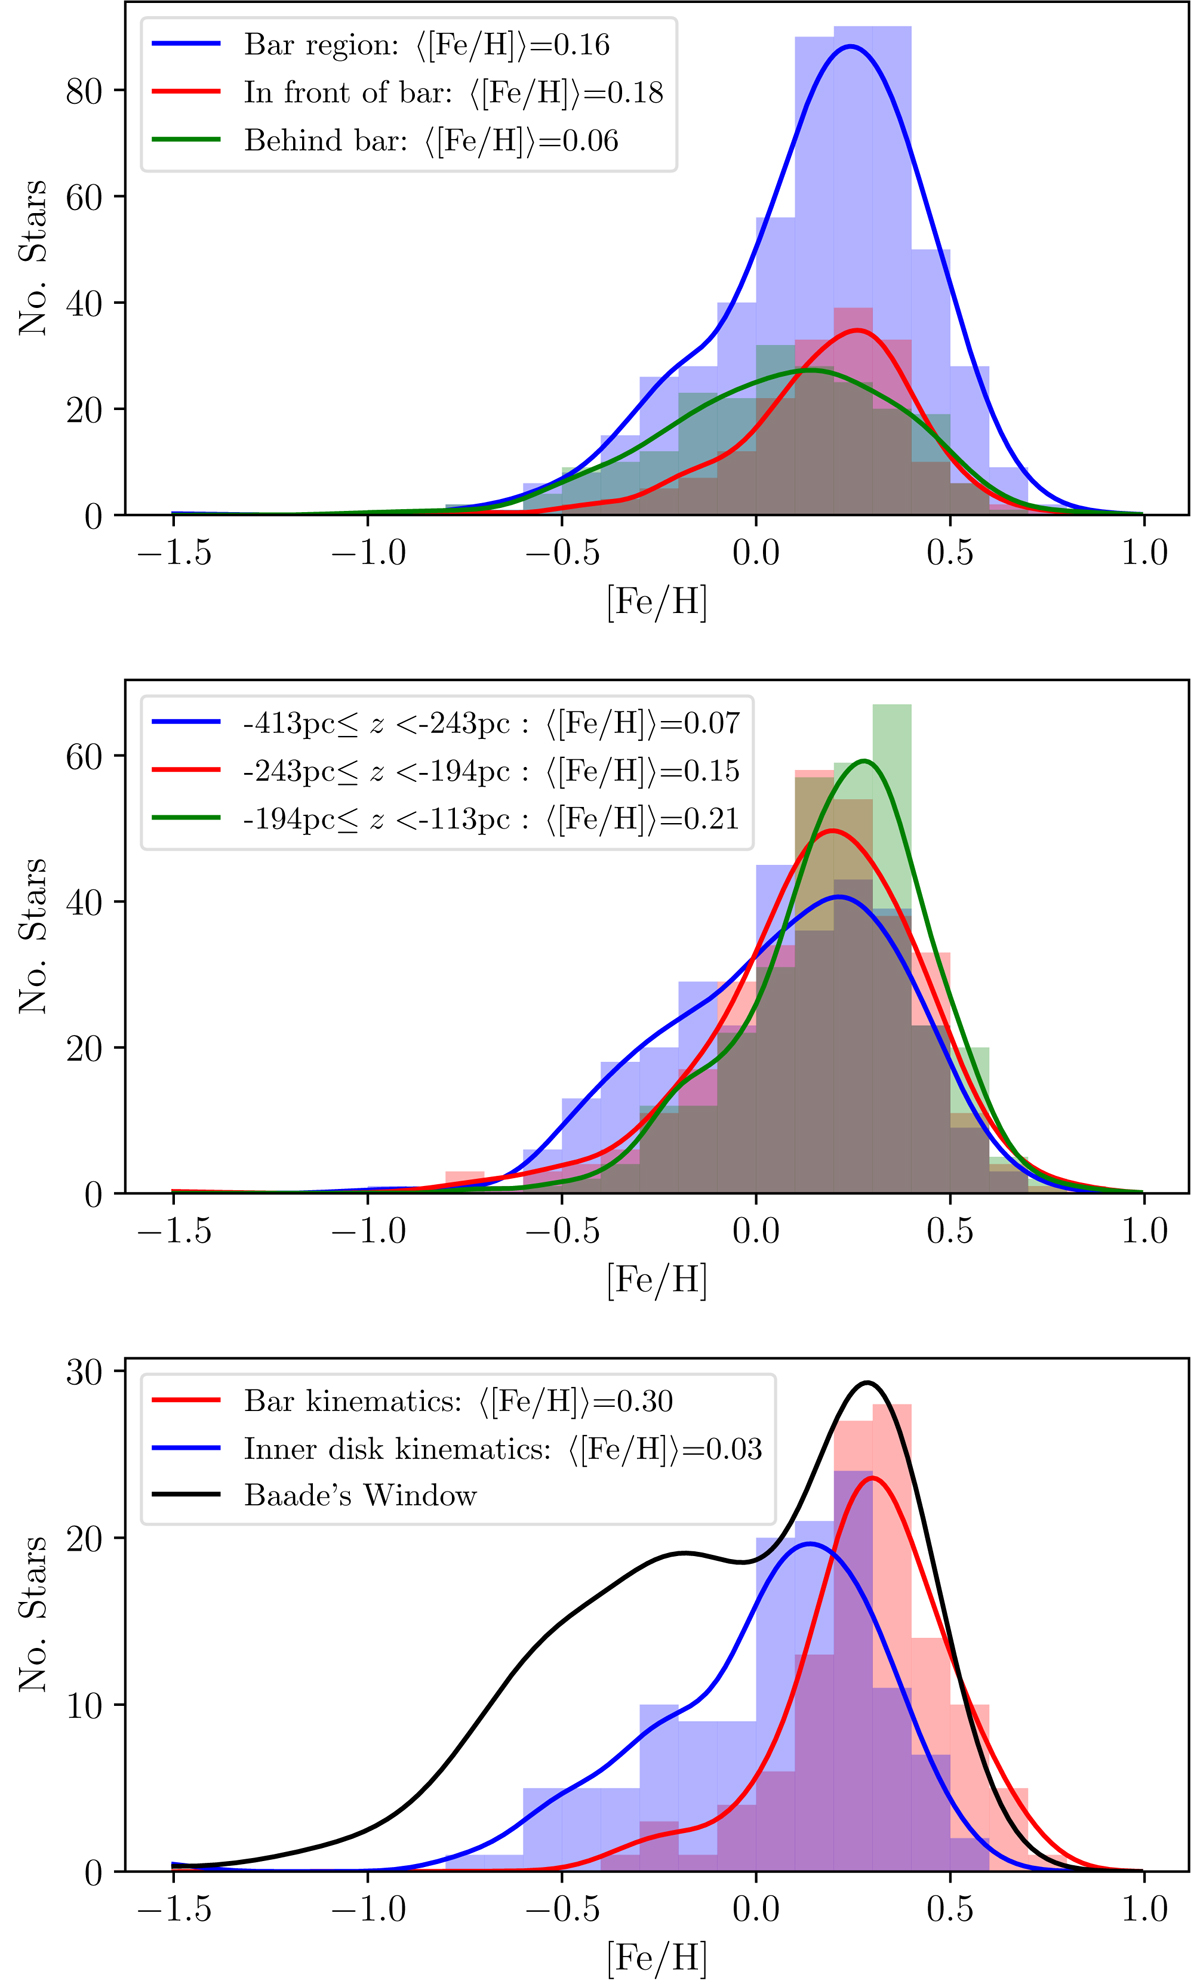
Fig. 5.

Upper panel: iron abundance distribution of stars within 0.5 kpc of the bar major axis (blue) compared to those in front and behind the bar (red and green, respectively). Middle panel: iron abundance distribution of stars in three vertical slices. The slices are chosen so each contains one-third of the sample. Lower panel: iron abundance distribution of stars spatially in the bar, separated kinematically into bar stars (red) and inner disc stars (blue; see Sect. 4.2 for details). Although these stars are in the same region of space, the stars on bar orbits are on average more metal rich than their inner disc counterparts. In black we show the iron abundance distribution of Baade’s window measured using the same instrument set-up (Schultheis et al. 2017). The highest metallicities in the bar are similar to those in the bulge, but there is a much smaller fraction of metal poor stars.
Current usage metrics show cumulative count of Article Views (full-text article views including HTML views, PDF and ePub downloads, according to the available data) and Abstracts Views on Vision4Press platform.
Data correspond to usage on the plateform after 2015. The current usage metrics is available 48-96 hours after online publication and is updated daily on week days.
Initial download of the metrics may take a while.


