Free Access
Fig. 7
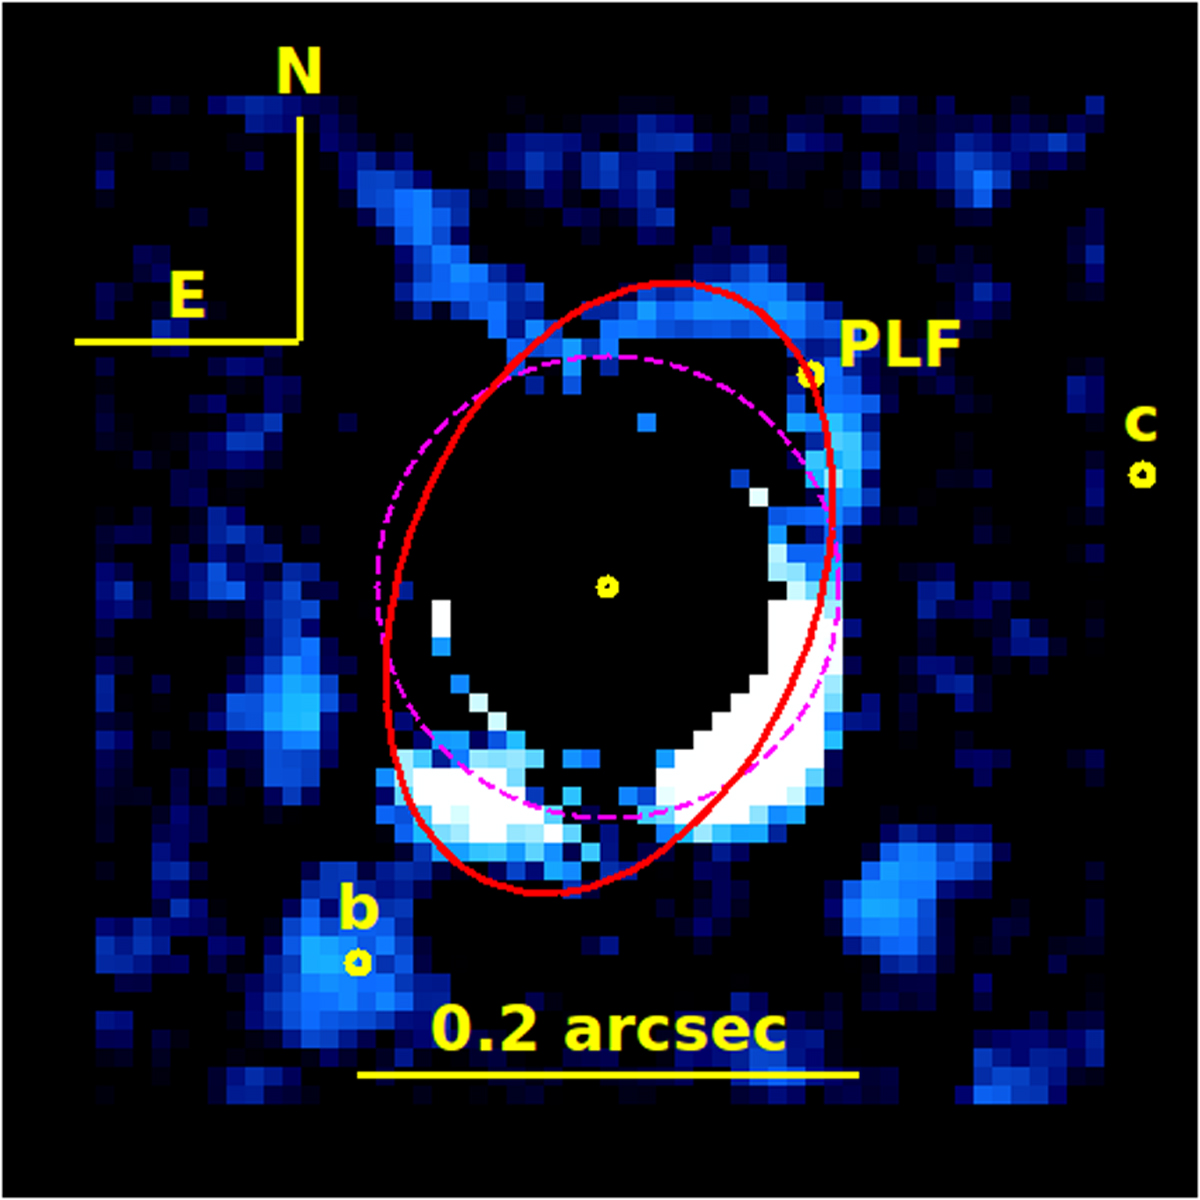
Imageresulting from the off-axis PSF subtraction described in the text. The red ellipse represents the estimated position for the inner disk. The dashed magenta circle represents the position of the coronagraph. The yellow circles are used to tag the positions of the point sources.
Current usage metrics show cumulative count of Article Views (full-text article views including HTML views, PDF and ePub downloads, according to the available data) and Abstracts Views on Vision4Press platform.
Data correspond to usage on the plateform after 2015. The current usage metrics is available 48-96 hours after online publication and is updated daily on week days.
Initial download of the metrics may take a while.