Fig. 6
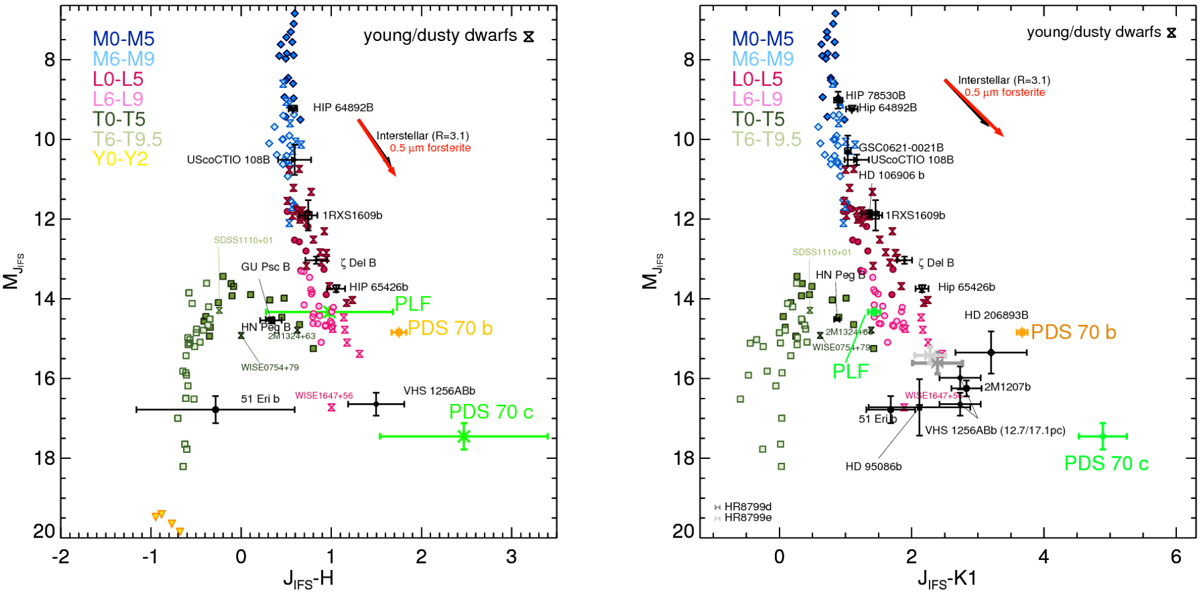
Left: positions of PDS 70 c and of the PLF (green stars) in the J–H vs. J color-magnitude diagram. The position of PDS 70 b (orange star) is also indicated for comparison. We also display the positions of field dwarfs indicated with different symbols according to the spectral type and of some low-mass companions. Moreover, we overplot the reddening vector computed for the synthetic extinction curve using RV = 3.1 (black arrow) and the reddening vector due to the extinction curve of forsterite (red arrow). Right: same as left panel but for the J–K1 versus J diagram.
Current usage metrics show cumulative count of Article Views (full-text article views including HTML views, PDF and ePub downloads, according to the available data) and Abstracts Views on Vision4Press platform.
Data correspond to usage on the plateform after 2015. The current usage metrics is available 48-96 hours after online publication and is updated daily on week days.
Initial download of the metrics may take a while.