Fig. 6.
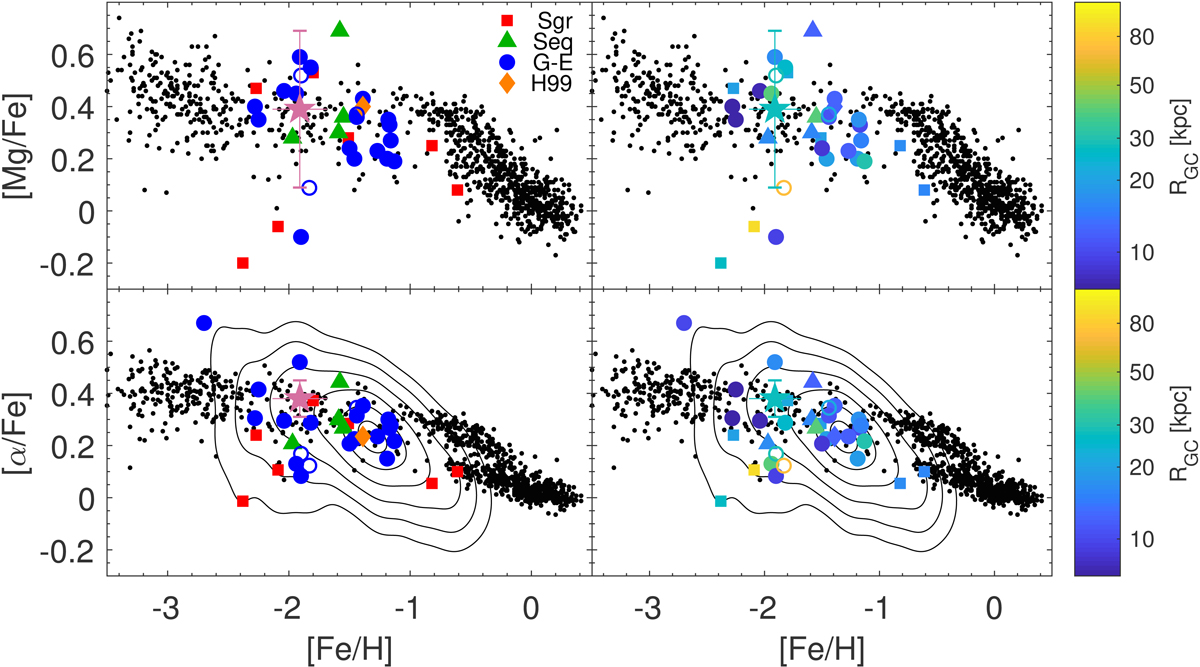
Mg and α-element ratios for Galactic stars, Pal 13 (star), and the GCs listed in Table 5, based on Massari et al. (2019). Left panel: the clusters are color-coded by their purported origin. Right panels: same data, but color-coded by (logarithmic) Galactocentric distance, maintaining the same symbols for the different progenitors. Contours in the [α/Fe] diagrams show the Gaia-Enceladus stellar component from Helmi et al. (2018) in terms of number densities from 0.5 to 3σ in steps of 0.5σ.
Current usage metrics show cumulative count of Article Views (full-text article views including HTML views, PDF and ePub downloads, according to the available data) and Abstracts Views on Vision4Press platform.
Data correspond to usage on the plateform after 2015. The current usage metrics is available 48-96 hours after online publication and is updated daily on week days.
Initial download of the metrics may take a while.