Fig. 3.
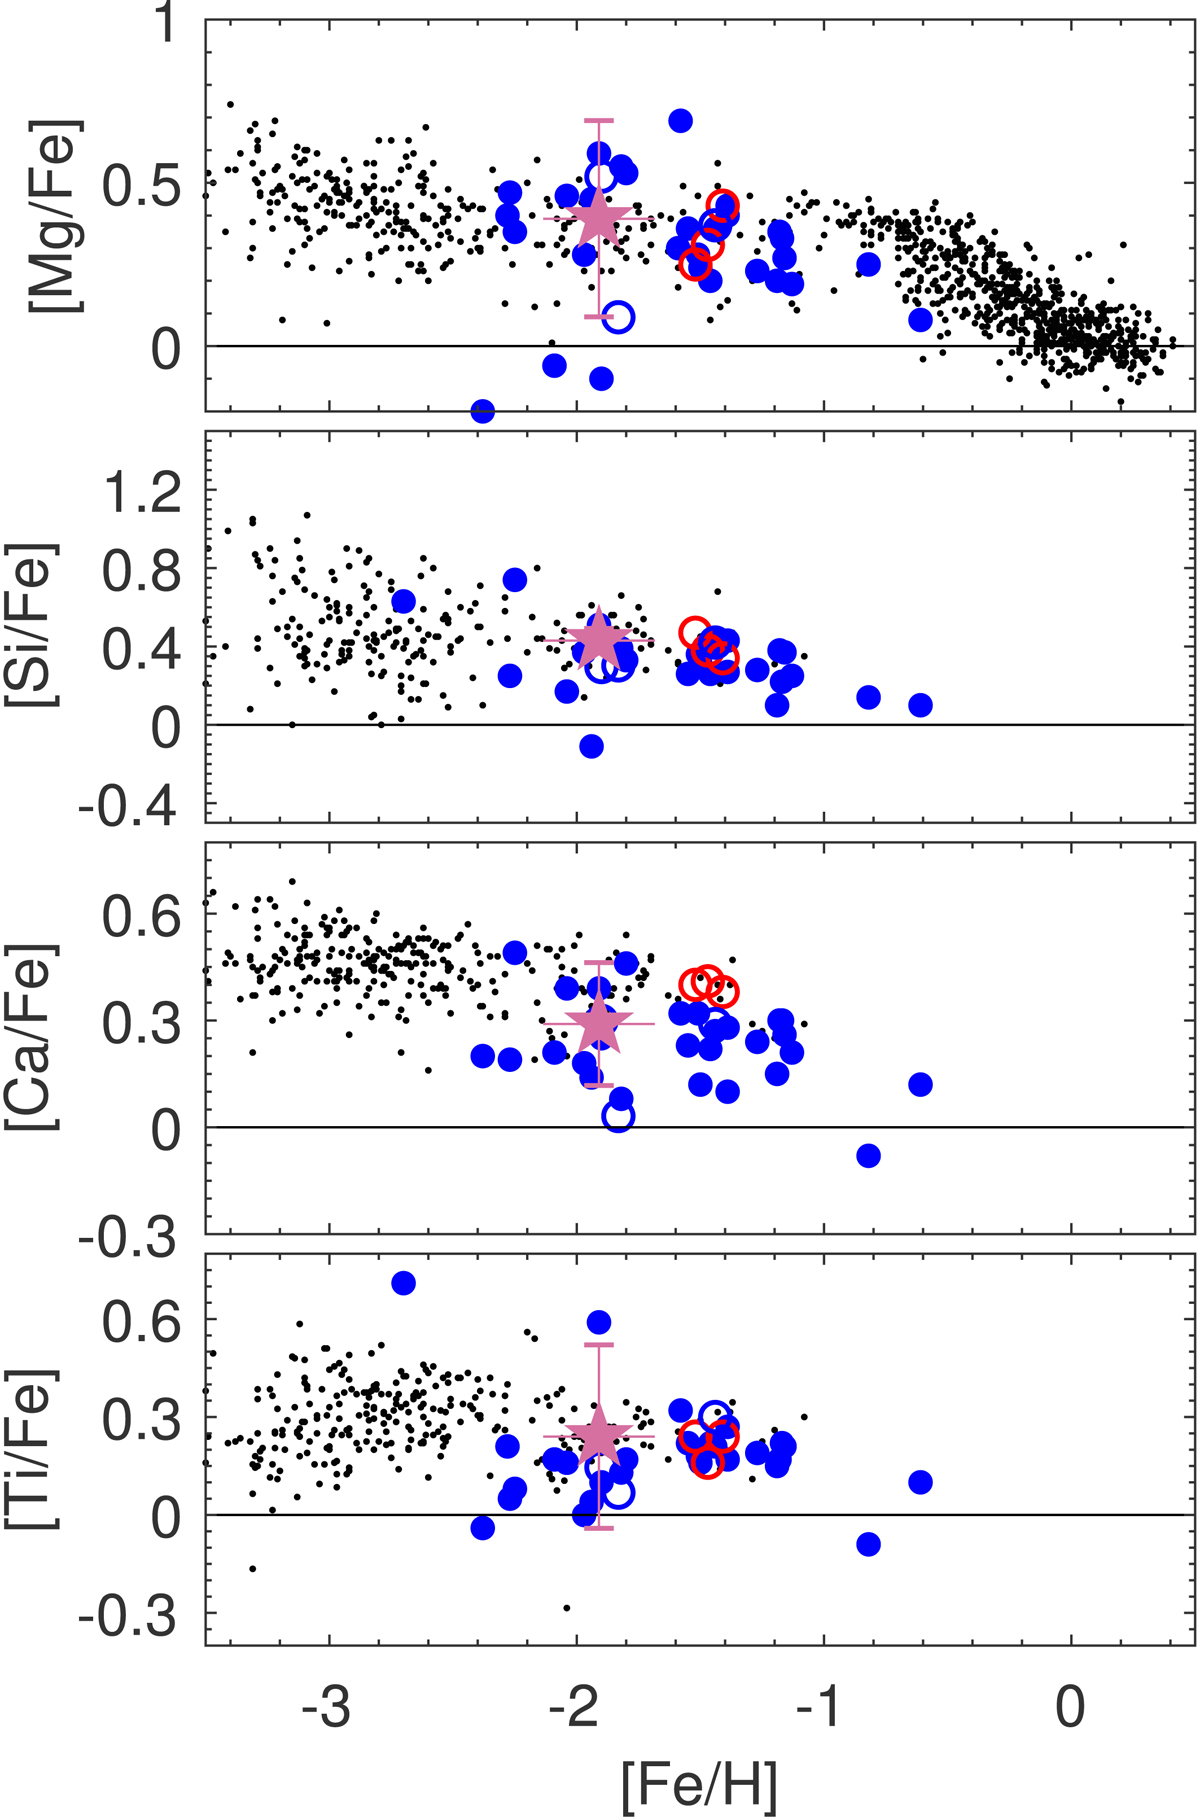
Abundance results for the α-elements. Literature data for the MW (black dots) are as follows: for the halo, Roederer et al. (2014); for the bulge, Johnson et al. (2012, 2014); and for the disks, Bensby et al. (2014). Pal 13 is shown as the orchid star, where the error bar accounts for both statistical and systematic uncertainties. Blue filled points indicate the abundances of the comparison GCs (see Table 5 for references), while open blue symbols denote outer halo GCs beyond 20 kpc that have not been uniquely assigned to a specific progenitor. We also show as red circles the results from our systematic coadded abundance study of outer halo GCs (Koch et al. 2009; Koch & Côté 2010, 2017).
Current usage metrics show cumulative count of Article Views (full-text article views including HTML views, PDF and ePub downloads, according to the available data) and Abstracts Views on Vision4Press platform.
Data correspond to usage on the plateform after 2015. The current usage metrics is available 48-96 hours after online publication and is updated daily on week days.
Initial download of the metrics may take a while.