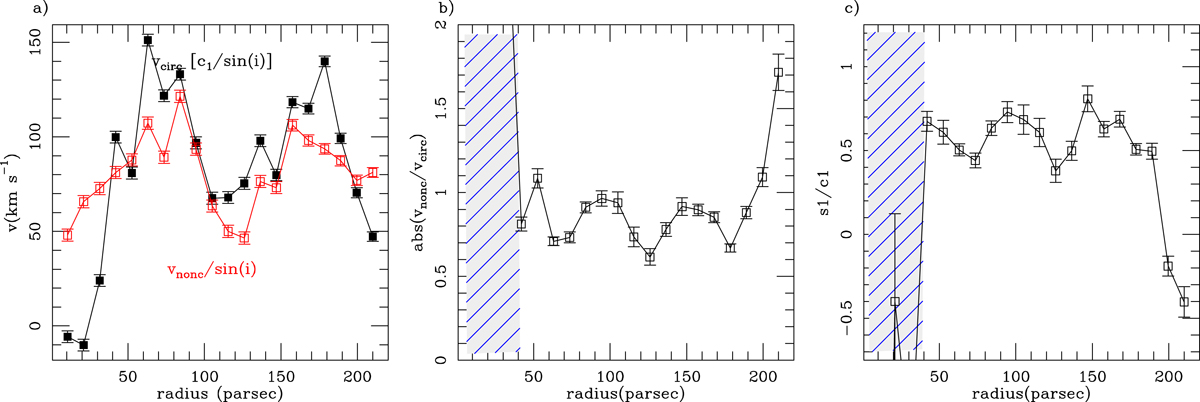
Fig. 7.

Left panel: radial profile of the c1/sin(i) ratio, which represents the best fit obtained by kinemetry for the deprojected axisymmetric circular component of the velocity field (vcirc; black curve and filled symbols). We also plot the radial profile of the deprojected noncircular motions (vnonc/sin(i)) derived from the Fourier decomposition until third order (red curve and open symbols). Middle panel: variation of the absolute value of vnonc/vcirc ratio as function of radius (black curve and open symbols). Right panel: variation of the s1/c1 ratio as function of radius. The s1 coefficient represents the best fit of the (projected) axisymmetric radial component of the velocity field (black curve and open symbols). The hatched gray-filled rectangles in panels (b) and (c) identify the region where the solution found by kinemetry is judged less reliable.
Current usage metrics show cumulative count of Article Views (full-text article views including HTML views, PDF and ePub downloads, according to the available data) and Abstracts Views on Vision4Press platform.
Data correspond to usage on the plateform after 2015. The current usage metrics is available 48-96 hours after online publication and is updated daily on week days.
Initial download of the metrics may take a while.


