Free Access
Fig. 6.
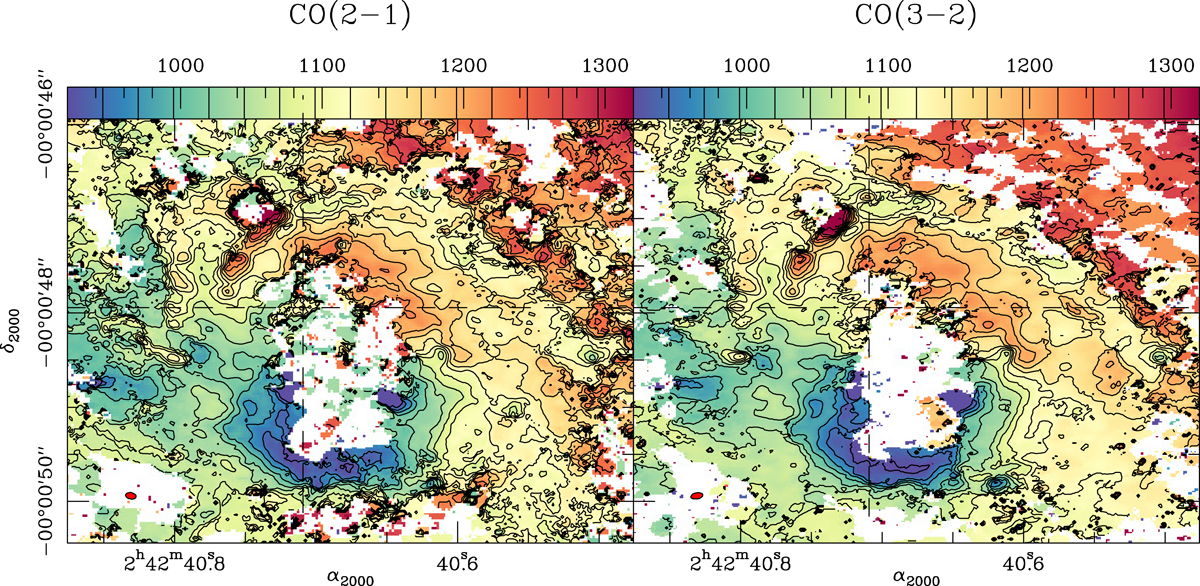
Mean-velocity fields derived for the CO(2–1) (left panel) and CO(3–2) (right panel) lines in the CND of NGC 1068, as obtained from the MSR data set. Isovelocity contours and color scale span the range [−200 + vsys, 200 + vsys] km s−1, where ![]() km s−1 in steps of 25 km s−1. Symbols and markers as in Fig. 3.
km s−1 in steps of 25 km s−1. Symbols and markers as in Fig. 3.
Current usage metrics show cumulative count of Article Views (full-text article views including HTML views, PDF and ePub downloads, according to the available data) and Abstracts Views on Vision4Press platform.
Data correspond to usage on the plateform after 2015. The current usage metrics is available 48-96 hours after online publication and is updated daily on week days.
Initial download of the metrics may take a while.