Fig. 5.
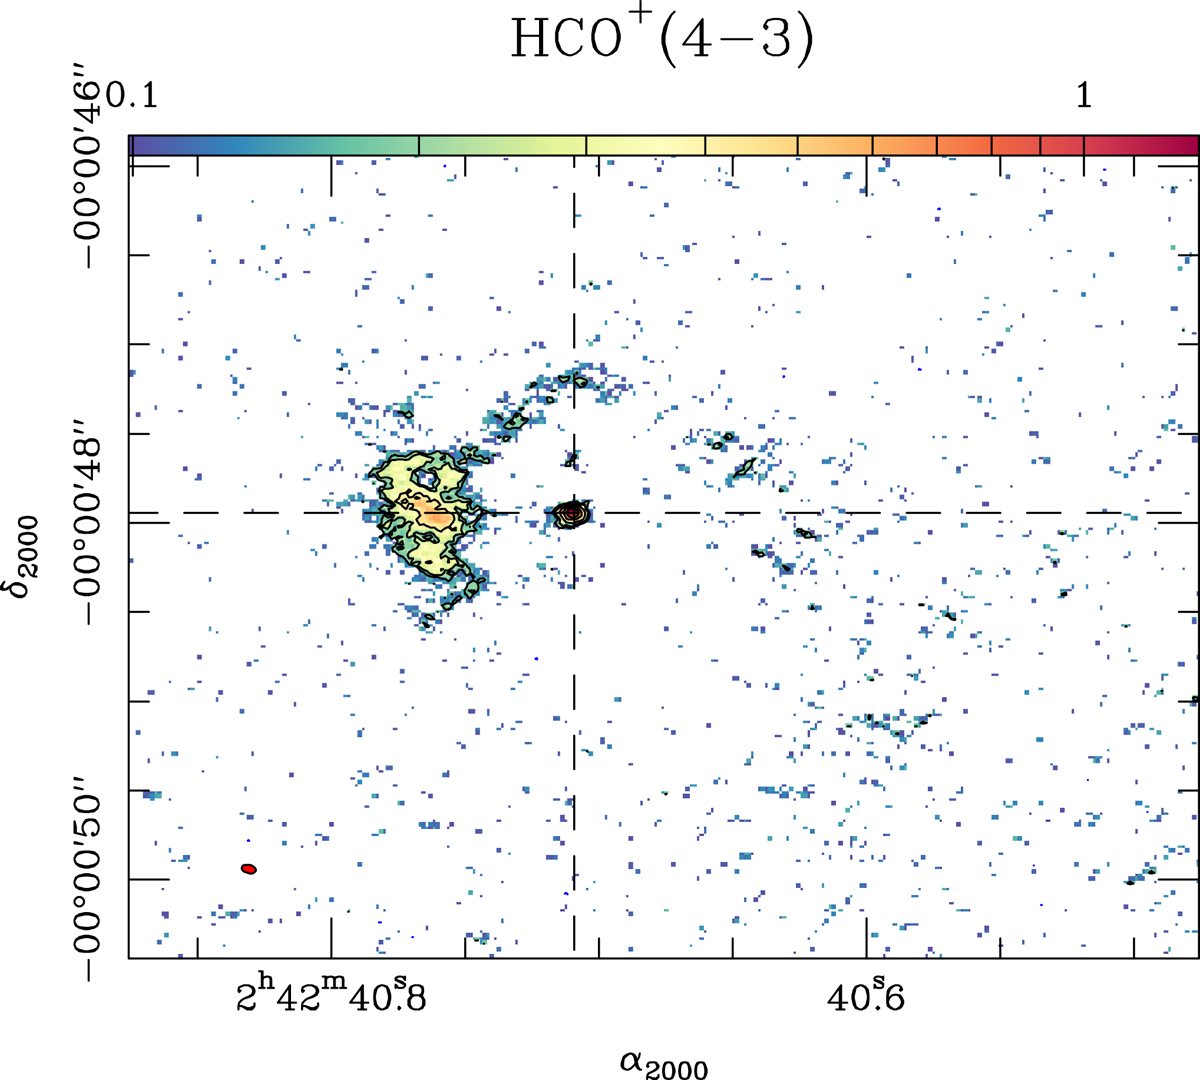
HCO+(4–3) integrated intensity map obtained with ALMA in the CND of NGC 1068 using the MSR data set as defined in Table 1. The map is shown in color scale spanning the range [3σ, 40σ] with contour levels −5σ (dashed contour), 5σ, 7σ, 12σ, 20σ, and 30σ where 1σ = 33 mJy km s−1 beam−1. Symbols and markers as in Fig. 3. The (red) filled ellipse at the bottom left corner represents the beam size in HCO+(4–3) (![]() at PA = 78°).
at PA = 78°).
Current usage metrics show cumulative count of Article Views (full-text article views including HTML views, PDF and ePub downloads, according to the available data) and Abstracts Views on Vision4Press platform.
Data correspond to usage on the plateform after 2015. The current usage metrics is available 48-96 hours after online publication and is updated daily on week days.
Initial download of the metrics may take a while.