Fig. 4.
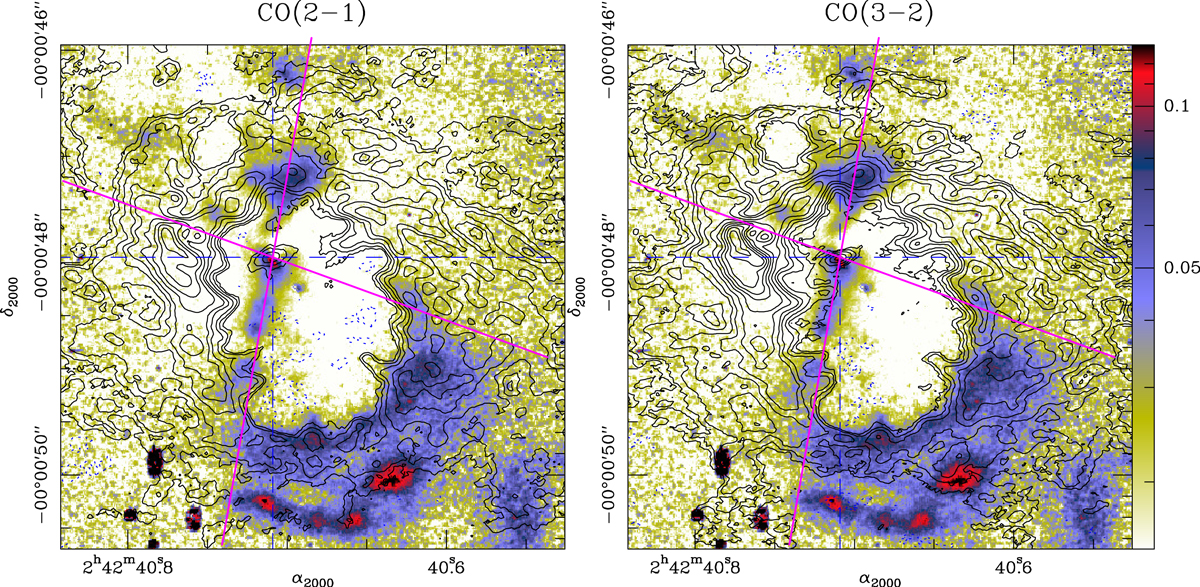
Left panel: we overlay the CO(2–1) contour map (levels as in Fig. 3) on the image of linear polarization of dust emission obtained in the H band by Gratadour et al. (2015) (color logarithmic scale from 1.5% to 13%). Right panel: same as left panel but showing the comparison between the CO(3–2) map and the polarization degree. The magenta lines identify the region occupied by the AGN wind bicone modeled by Das et al. (2006): PAoutflow = 30°, FWHMouter = 80° (see also Barbosa et al. 2014).
Current usage metrics show cumulative count of Article Views (full-text article views including HTML views, PDF and ePub downloads, according to the available data) and Abstracts Views on Vision4Press platform.
Data correspond to usage on the plateform after 2015. The current usage metrics is available 48-96 hours after online publication and is updated daily on week days.
Initial download of the metrics may take a while.