Fig. A.2.
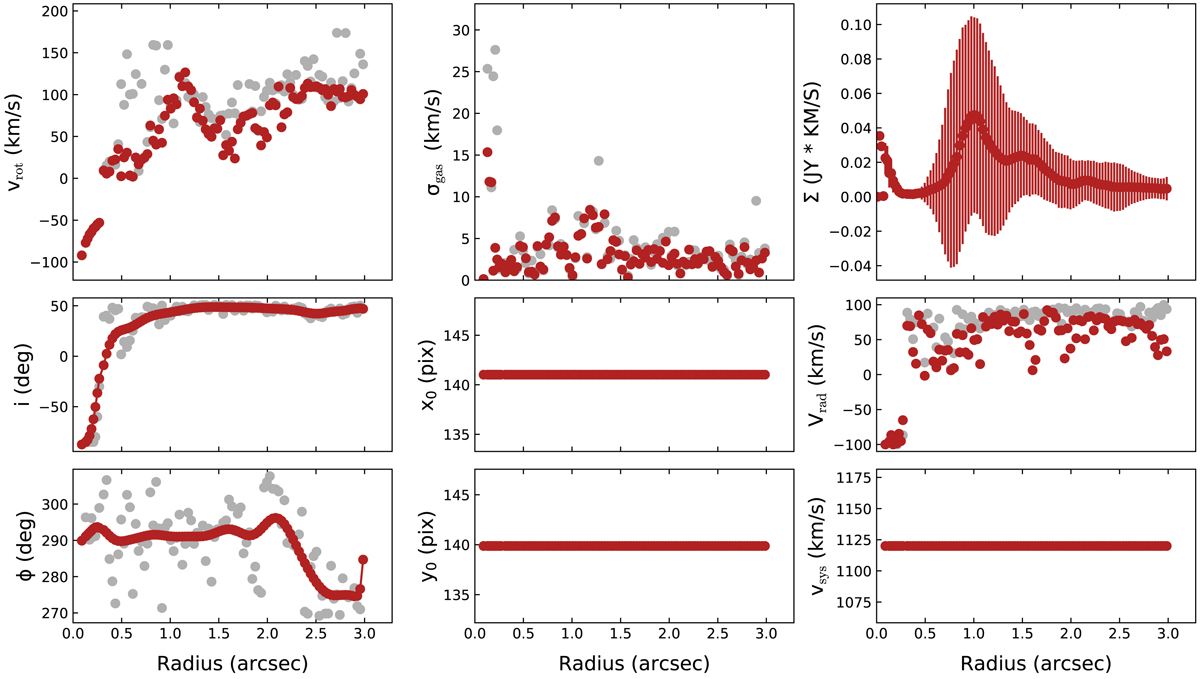
Radial profiles of the best fit found by 3DBarolo for vrot, vrad, vdisp (σgas), PA (ϕ), and i. The position of the AGN (xo and yo in pixel units) and the systemic velocity (vsys) are fixed to the values previously found by kinemetry. The size of the vertical bars in the radial profile of integrated intensities (Σ) reflect the deviations from axisymmetry in the gas distribution. The gray and red markers represent the output values of the fitted parameters obtained after the first (step-1) and second (step-2) runs, respectively.
Current usage metrics show cumulative count of Article Views (full-text article views including HTML views, PDF and ePub downloads, according to the available data) and Abstracts Views on Vision4Press platform.
Data correspond to usage on the plateform after 2015. The current usage metrics is available 48-96 hours after online publication and is updated daily on week days.
Initial download of the metrics may take a while.