Fig. 3.
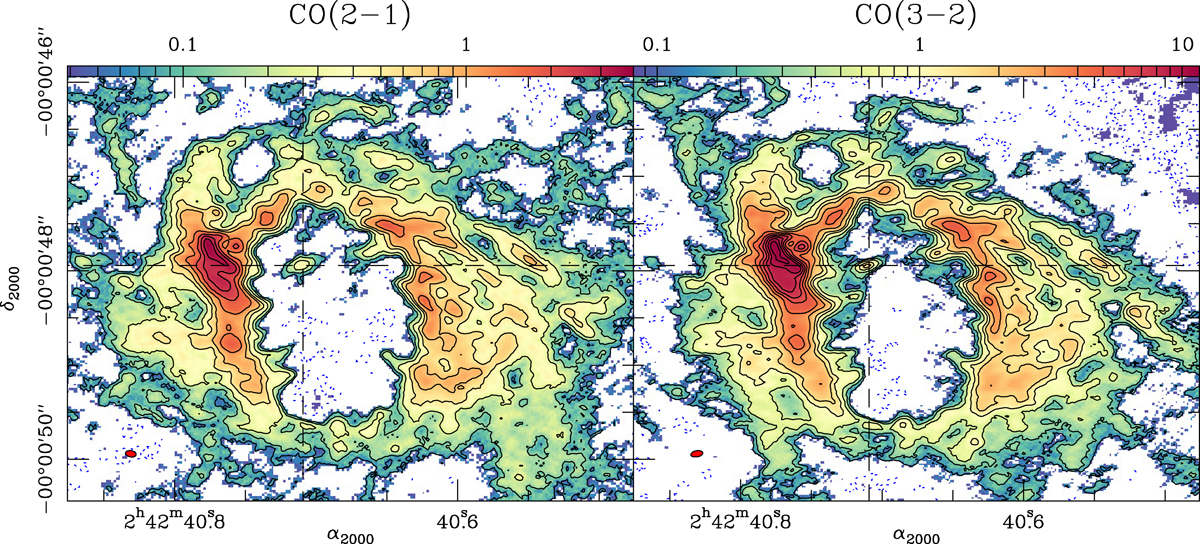
Left panel: CO(2–1) integrated intensity map obtained with ALMA in the CND of NGC 1068 using the MSR data set as defined in Table 1. The map is shown in color scale spanning the range [3σ, 300σ] in logarithmic scale with contour levels −5σ (dashed contour), 5σ, 10σ, 20σ, 40σ, 60σ, 100σ–250σ in steps of 50σ where 1σ = 13 mJy km s−1 beam−1. Right panel: same as left panel but showing the CO(3–2) integrated intensity map. The color scale spans the range [3σ, 430σ] in logarithmic scale with contour levels −5σ (dashed contour), 5σ, 10σ, 20σ, 40σ, 60σ, 100σ–400σ in steps of 50σ where 1σ = 27 mJy km s−1 beam−1. The AGN locus lies at the intersection of the dashed lines in both panels. The (red) filled ellipses in the bottom left corners of both panels represent the beam sizes in CO(2–1) (![]() at PA = 80°) and CO(3–2) (
at PA = 80°) and CO(3–2) (![]() at PA = 100°).
at PA = 100°).
Current usage metrics show cumulative count of Article Views (full-text article views including HTML views, PDF and ePub downloads, according to the available data) and Abstracts Views on Vision4Press platform.
Data correspond to usage on the plateform after 2015. The current usage metrics is available 48-96 hours after online publication and is updated daily on week days.
Initial download of the metrics may take a while.