Free Access
Fig. A.1.
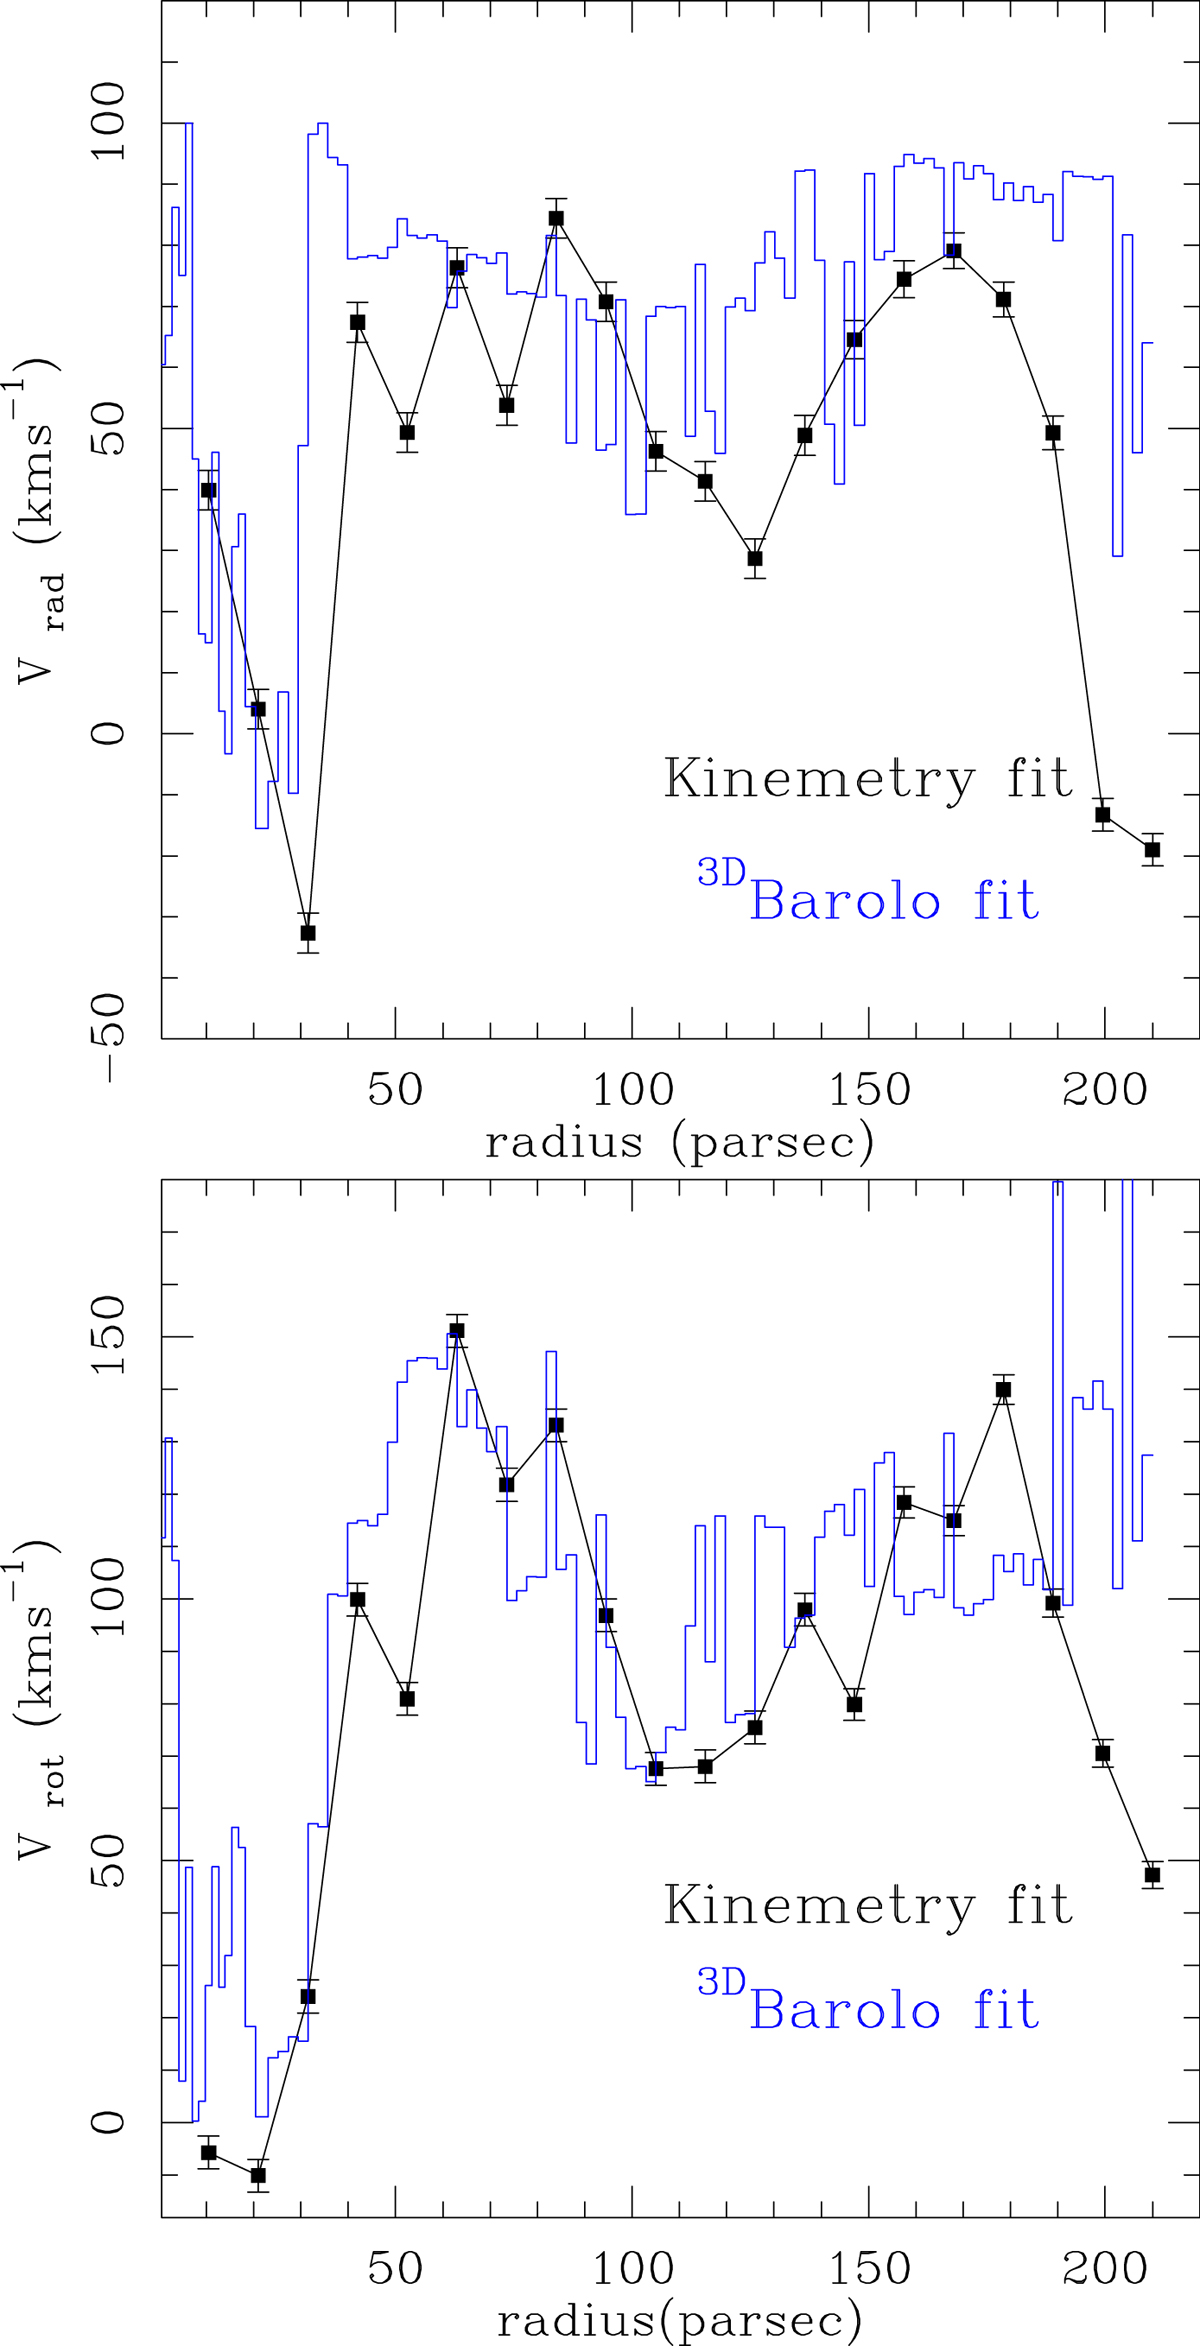
Radial profiles of vrad (upper panel) and vrot (lower panel) found by 3DBarolo (blue histograms) and kinemetry (black line and markers) to fit the CO(2–1) data of the CND region out to r ≃ 210 pc.
Current usage metrics show cumulative count of Article Views (full-text article views including HTML views, PDF and ePub downloads, according to the available data) and Abstracts Views on Vision4Press platform.
Data correspond to usage on the plateform after 2015. The current usage metrics is available 48-96 hours after online publication and is updated daily on week days.
Initial download of the metrics may take a while.