Fig. 28.
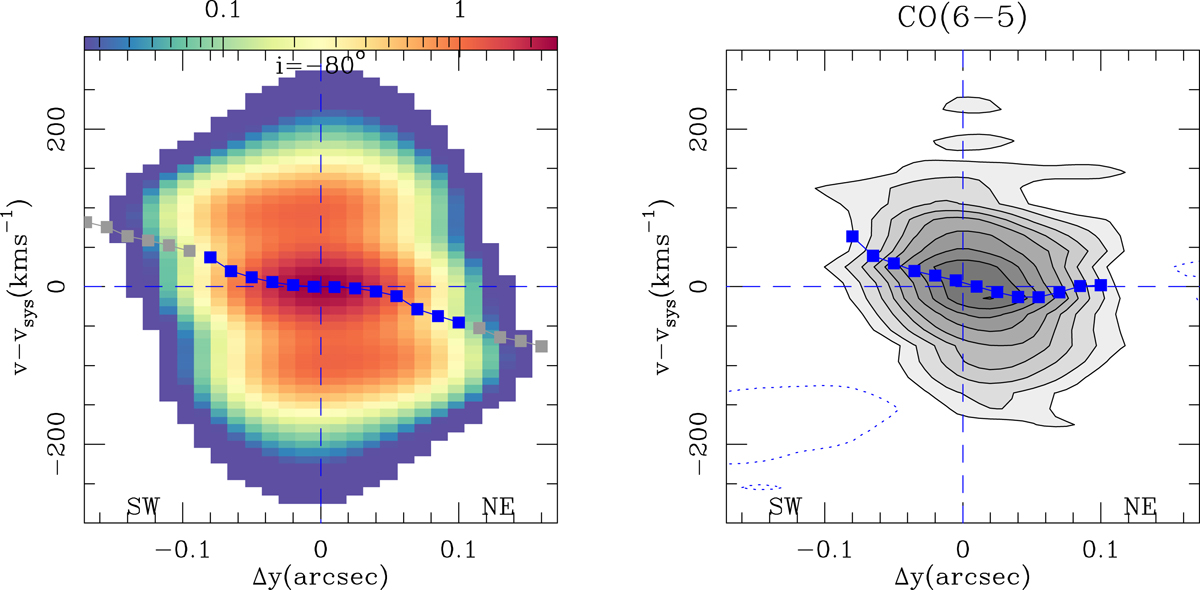
Comparison of the minor axis p − v plot predicted by the OUT-model of the torus described in Sect. 7.2 with the corresponding CO(6–5) minor axis p − v plot obtained from the combined data set of García-Burillo et al. (2016) and Gallimore et al. (2016). The square markers highlight in both panels the velocity centroid of the emission as a function of position along the minor axis.
Current usage metrics show cumulative count of Article Views (full-text article views including HTML views, PDF and ePub downloads, according to the available data) and Abstracts Views on Vision4Press platform.
Data correspond to usage on the plateform after 2015. The current usage metrics is available 48-96 hours after online publication and is updated daily on week days.
Initial download of the metrics may take a while.