Fig. 26.
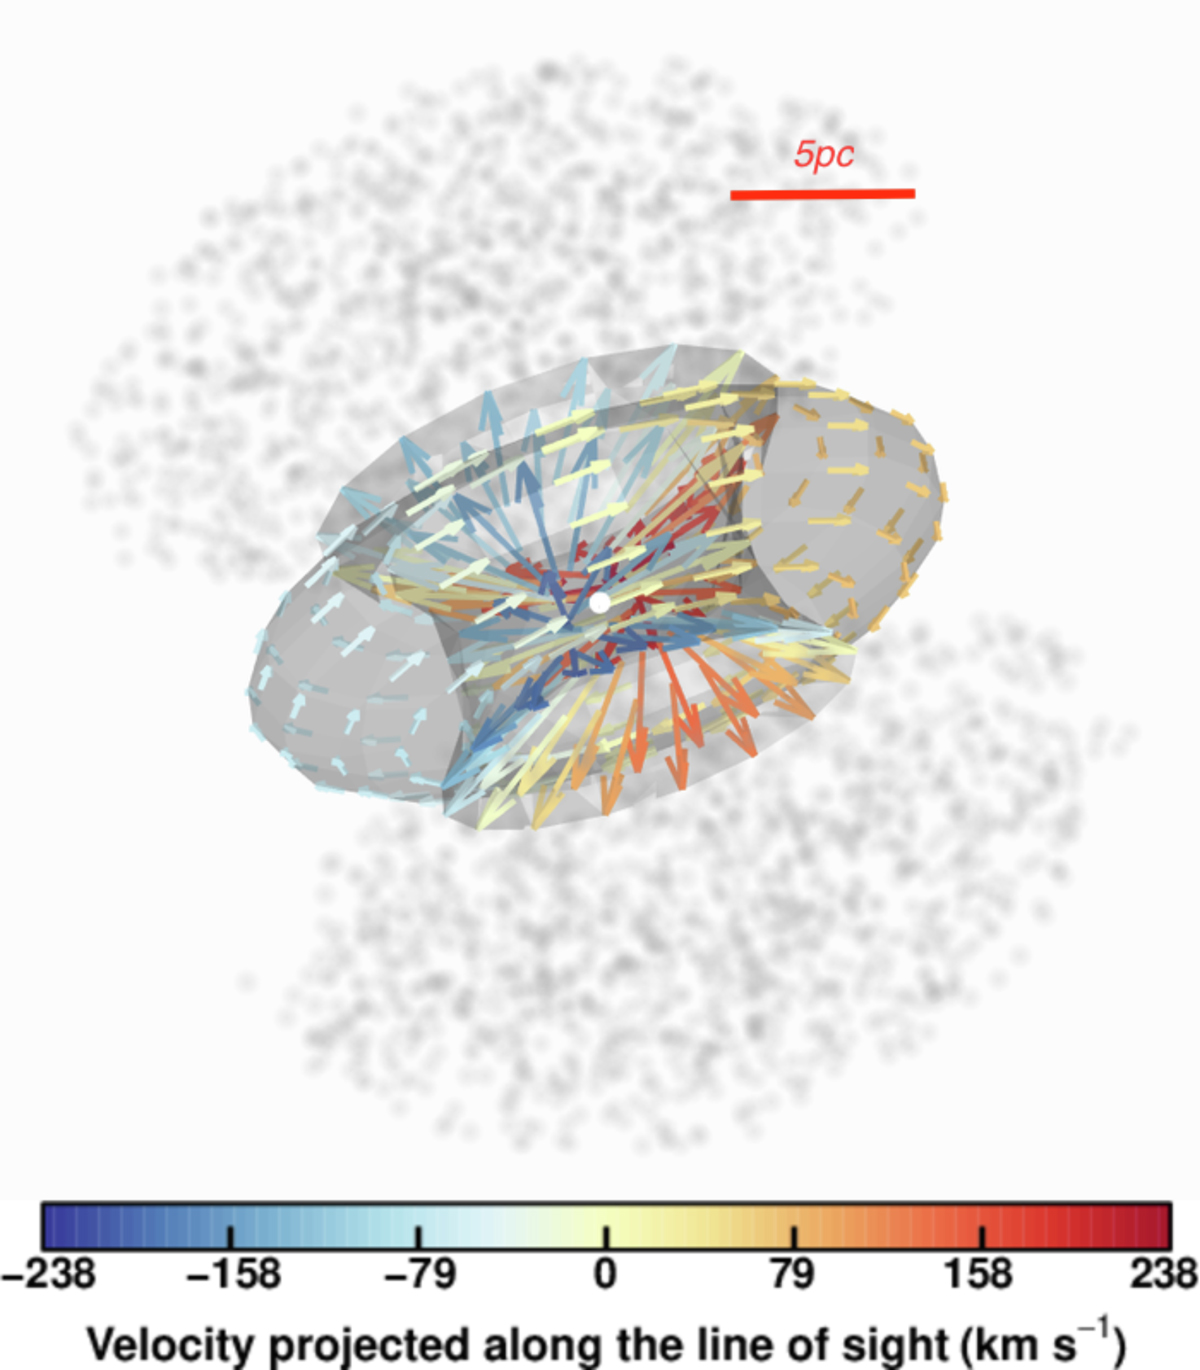
View of the kinematic model of the molecular torus described in Sect. 7 projected along the line of sight. The arrows represent the velocity field of the gas in the torus (with Keplerian rotation) and over the working surface of the AGN wind on the torus (with outflowing motions). The arrows are color-coded using red, yellow, and blue according to the absolute value and the sign of the radial velocities projected along the line-of-sight measured relative to vsys. The major axis of the modeled torus has the orientation of the observed torus (PA ≃ 113°). The adopted inclination (i ≃ −70°) is lower than the average value found by 3DBarolo (i ≃ −80°) for a better illustration of the different velocity components of the model.
Current usage metrics show cumulative count of Article Views (full-text article views including HTML views, PDF and ePub downloads, according to the available data) and Abstracts Views on Vision4Press platform.
Data correspond to usage on the plateform after 2015. The current usage metrics is available 48-96 hours after online publication and is updated daily on week days.
Initial download of the metrics may take a while.